


XrViz is an interactive graphical user interface(GUI) for visually browsing Xarrays. You can view data arrays along various dimensions, examine data values, change color maps, extract series, display geographic data on maps and much more. It is built on Xarray, HvPlot and Panel. It can be used with Intake to ease the process of investigating and loading datasets.
Documentation is available at Read the Docs.
Try it out on binder:
Recommended method using conda:
conda install -c conda-forge xrviz
You can also install using pip:
pip install xrviz
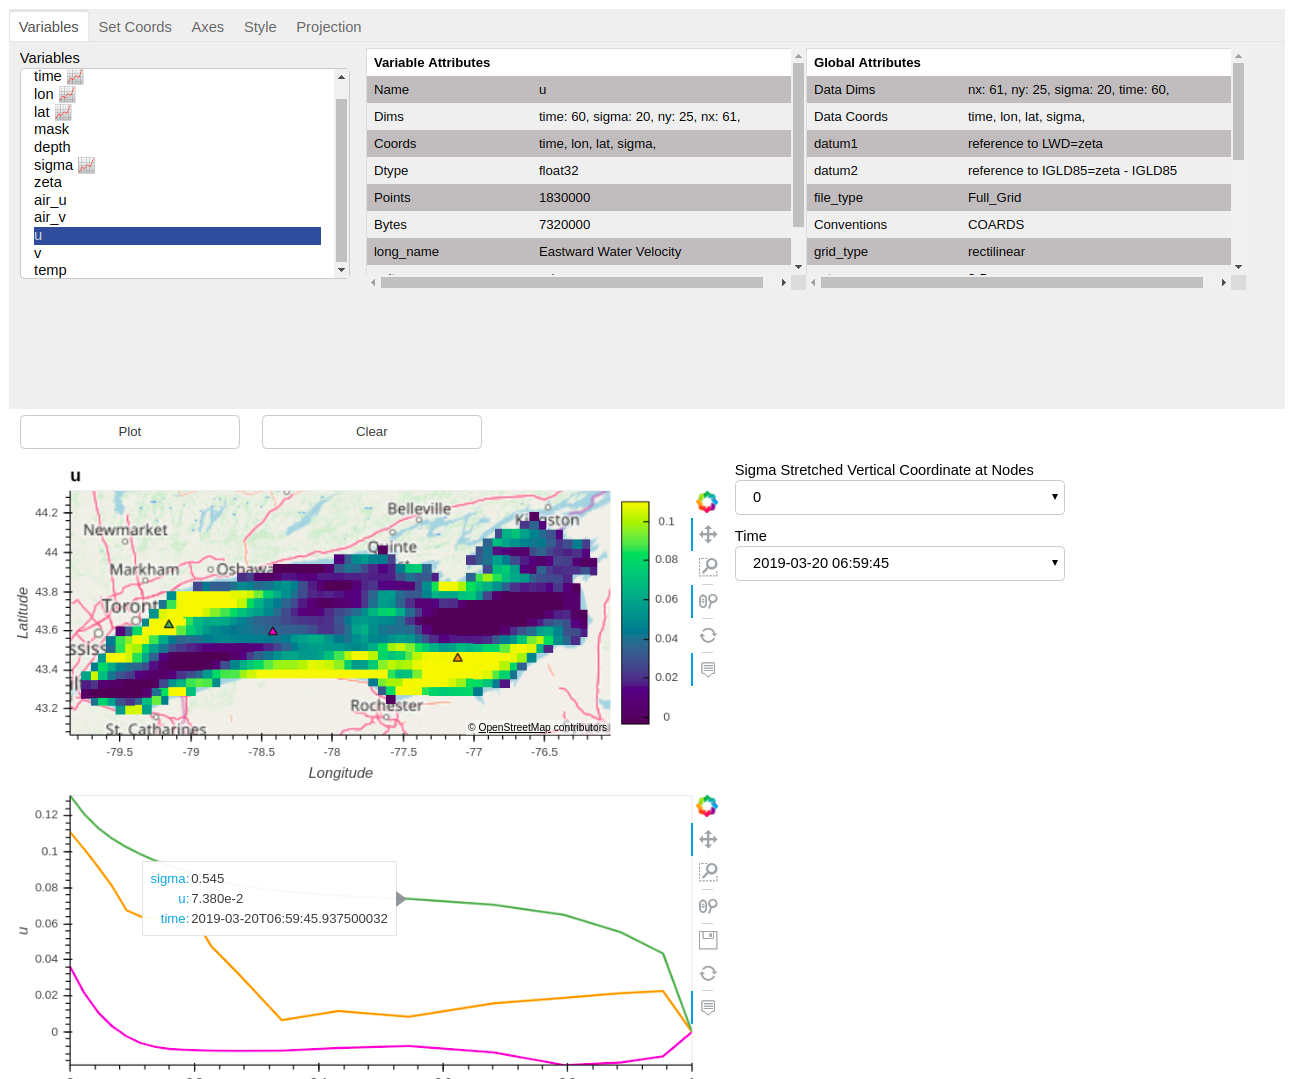
You can view the example dashboard by running following in command line (this will open a tab in your browser):
python -c "import xrviz; xrviz.example()"