Skip to content
New issue

Have a question about this project? Sign up for a free GitHub account to open an issue and contact its maintainers and the community.

By clicking “Sign up for GitHub”, you agree to our terms of service and privacy statement. We’ll occasionally send you account related emails.

Already on GitHub? Sign in to your account

Tooltips appear on another trace's area when there is more than one axis #8482

Closed
bbonczek opened this issue Jun 15, 2018 · 3 comments
Closed
Labels
Status: Stale This issue hasn't had any activity for a while, and will be auto-closed if no further updates occur. Type: Bug

Comments

@bbonczek
Copy link

bbonczek commented Jun 15, 2018

Expected behaviour

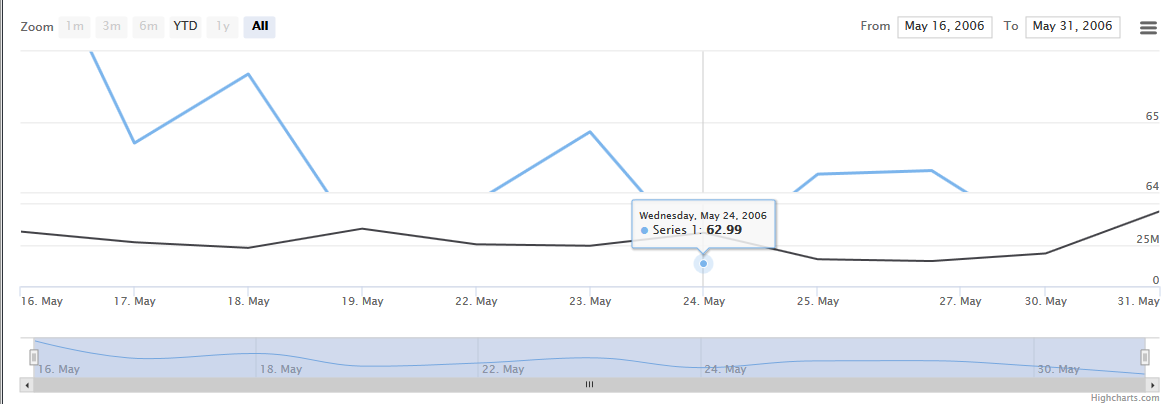
If I want to show chart with 2 traces one above the other, and extremes for the higher one are cutting part of trace (so it 'overlaps' to one below) the tooltip should not appear.

Actual behaviour

The tooltip appears:
obraz

Live demo with steps to reproduce

https://jsfiddle.net/092bsmod/

Product version

Highstock 6.1.0

Affected browser(s)

Chrome, firefox

@sebastianbochan
Copy link
Contributor

Hi @bbonczek,
Thank you for reporting.

Workaround
Disable stickyTracking.

Demo:

@bbonczek
Copy link
Author

Workaround works, thank you!

@stale
Copy link

stale bot commented Dec 18, 2019

This issue has been automatically marked as stale because it has not had recent activity. It will be closed if no further activity occurs. Thank you for your contributions!

@stale stale bot added the Status: Stale This issue hasn't had any activity for a while, and will be auto-closed if no further updates occur. label Dec 18, 2019
@stale stale bot closed this as completed Dec 25, 2019
Sign up for free to join this conversation on GitHub. Already have an account? Sign in to comment
Labels
Status: Stale This issue hasn't had any activity for a while, and will be auto-closed if no further updates occur. Type: Bug
Projects
None yet
Development

No branches or pull requests

2 participants