Massive logs from Hasura v2.13.0 #9129
-
|
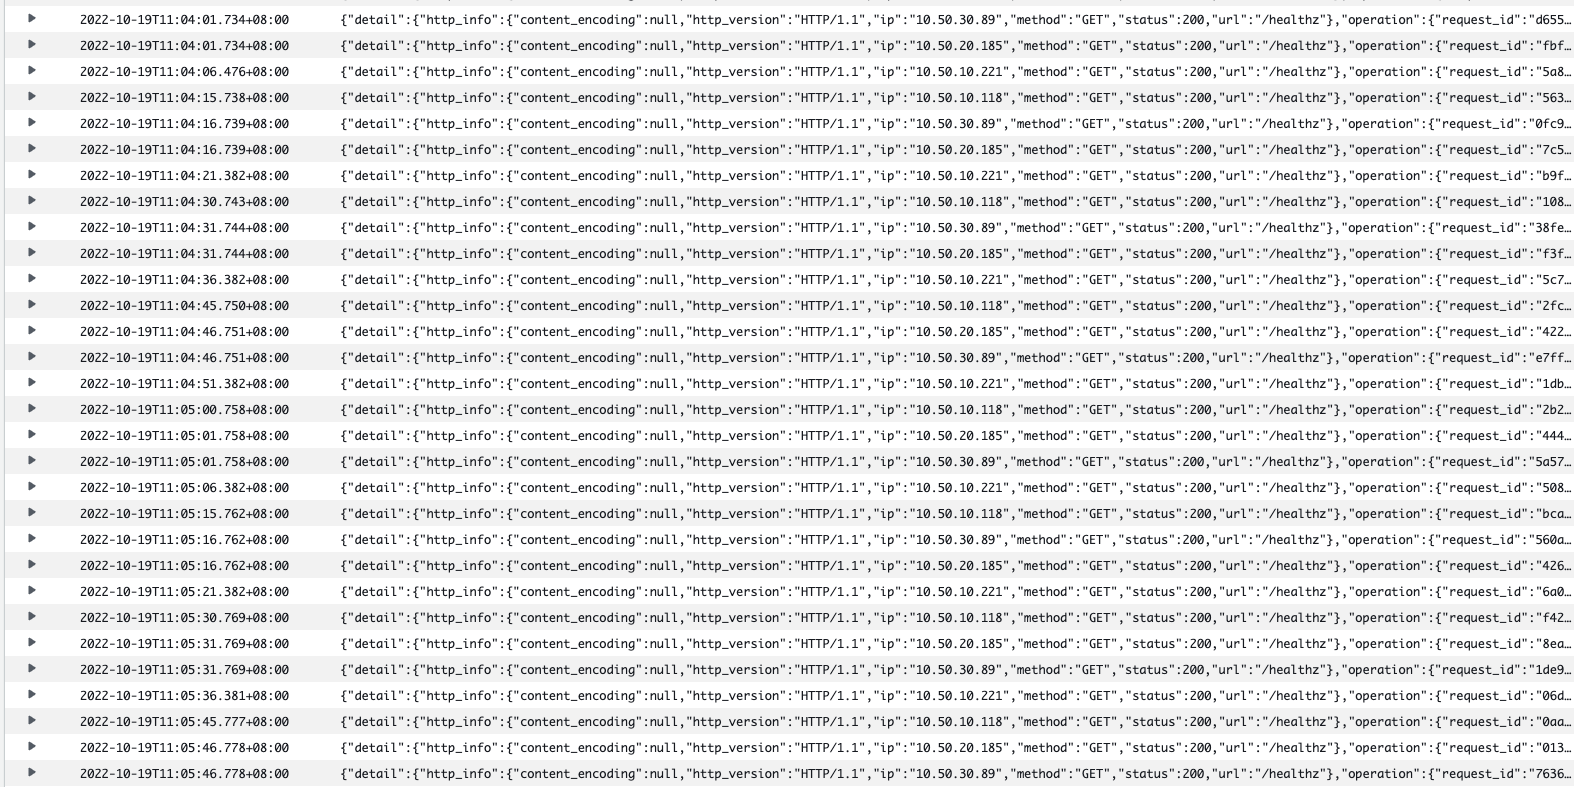
We just upgraded our Hasura from older v1.3.2 to v2.13.0. The upgrades went well however we discover some massive logs that appear almost every 1 to 5 seconds that says something like this:
We couldn't figure out if these are health check logs as they seem to be different to what has been documented here: https://hasura.io/docs/latest/deployment/logging/#health-check-log-structure We would like to know what logs are these and how do we adjust the interval or even disable them totally as they are killing out logs quota! |
Beta Was this translation helpful? Give feedback.
Replies: 2 comments 2 replies
-
|
Are you using self-hosted version of Hasura or Hasura Cloud ? Seeing those records, those logs are health check logs. We can see that pattern of logs pointing to |
Beta Was this translation helpful? Give feedback.
-
|
Hello @meetzaveri We are hosting the Hasura in our AWS ESC Fargate container by pulling Hasura Docker image:
We suspect they are health checks too but what we do not understand is that it's making health check to 4 different IPs. One of the IPs is the Hasura container itself and we couldn't figure out the what are the other 3 IPs from. We thought one of the other 3 might be the database server as Hasura can do Source Health Check but that does not seem to be case as that is available for Cloud edition if not mistaken. Why would Hasura checking health checks for different IPs other than itself? In fact we are fine that it's doing health check, but how do we configure the interval? Right now it's doing like every 1 to 5 seconds! We are unable to figure out what types of health check are these and where to configure them. |
Beta Was this translation helpful? Give feedback.
-
|
Unfortunately, we don't have configuration to set frequency of logs generated by engine. Moreover, I've created a GH issue as a feature request as we received request from other users regarding this type of feature. Link - #9833 Please comment or add reaction there so that it can gain some traction. This would help other users to raise their opinion and eventually based on the reception it receives, it will prove as a validation for product team to include this as a feature request. |
Beta Was this translation helpful? Give feedback.
-
The By default, Hasura sets the logging level to
To change the One can also configure the types of logs that are to be displayed using the Quick Summary
|
Beta Was this translation helpful? Give feedback.
The
healthzendpoint is an internal log, with the log level beinginfofor healthy instance andwarnfor unhealthy instances.By default, Hasura sets the logging level to
infoand to reduce the number of logs being captured, one can always set thelog-level = warnto display only the logs of levels from and abovewarn, which also includeserror.To change the
log-level, use the ENV variableHASURA_GRAPHQL_LOG_LEVEL = warn. For more info on the log level, refer this documentationOne can also configure the types of logs that are to be disp…