Support converting epoch time to datetime #6297
Comments
|
+1 |
11 similar comments
|
+1 |
|
+1 |
|
+1 |
|
+1 |
|
+1 |
|
+1 |
|
+1 |
|
+1 |
|
+1 |
|
+1 |
|
+1 |
|
I think it's solved, just multiply it by 1000, and choose the type as Date |
|
Thanks @liyuankui. That's a quick & easy solution. |
|
Do we have a type Date? |
|
I am looking to do the exact same thing , display an epoch timestamp in human readable date in a singlestat. Can't seem to find the type Date . Is it there in any specific version ? Any help appreciated. |
|
I ended up using the prometheus query language itself to get the time in seconds and selected the stat as a duration in seconds (time() - singlestatquery) |
|
would you mind sharing the promQL snippet? |
|
time()-(process_start_time_seconds) time() function in prometheus is used to get the current time in epoch. So you can use it to calculate the no. of seconds since the process last started. Choose the singlestat unit as time duration in seconds . |
|
implemented in #6297 add 3 new unit formats for dates |
|
Hi! |

|
@karlsoon use scale function to multiply it by 1000
|

|
... and how might you do this for table data? |
|
@rafawhs Hi,rafawhs, what's the data source? I use prometheus and i can't find the |
|
@ResolveWang Graphite! |
|
I am also not able to view scale function. im using prometheus as data source. Please help |
|
@ResolveWang @Rekhs123 |
|
anyway to convert epoch to human datetime in a table graph with a postgresql datasource? |
|
@cvernooy23 use the column style date and select date format |
|
@marefr How do you convert epoch to milliseconds inside a Prometheus Table? This is why I can`t use the date format. |
|
@mjtrangoni see comment above. If not applicable please share your query you're using. |
|
@marefr Yes, sorry, I was wrong and thought it was a column from a metric label, but it turn out this is indeed the value. |
|
@mjtrangoni Given you have a label with epoch timestamp in millisecond format I think it should work to use column style date. If you need to do conversion your limited to solve that using prometheus query api. For the singlestat panel the support is broader, see demo. |
|
Hi, I want to show uptime of my container on grafana, for that I have used something like |
|
Putting Date and Time on a dashboard seems pretty fundamental. How do I do that? I used a singlestat to get Time of last point, of some arbitrary metric, which returns it in some non human readable format. I select YYYY-MM-DD HH:mm:ss for Unit, which converts it to just time. I assume it is because it is so recent? Why would Grafana make that kind of decision. If I wanted just time, there should be a HH:mm:ss selection! This thread goes back and forth I never see a definitive answer yet it is closed. Using 6.4.1. |
Hi .i solved this problem.HUAWEI-ENTITY-EXTENT-MIB::hwEntityManufacturedDate.67108873 = STRING: 2018-11-19,0:0:0.0HELP hwEntityManufacturedDate This object indicates the manufacturing date of an entity.
The verification obtained by snmp is not accurate, let's correct it.
Thanks. |
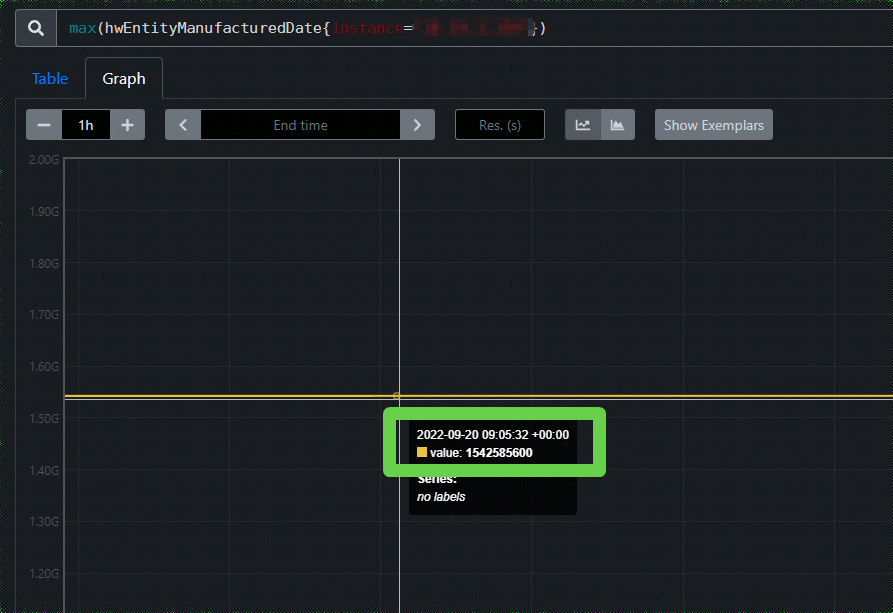

In the process, I've learned that:

1) I need to know my config at Collector creation time; I can't create
a stub Collector and have it read the config - That way leads to
panics that I don't understand /shrug

2) Prometheus will take the timestamp (a simple in), *force* me to
cast it to a float64, and then display it in scientific notation

3) Grafana can and will handle this stupidity, but not before adding
its own: it assumes timestamps are in milliseconds, so I have to take
my field/value, multiply it by 1000, and then select a Date type, per
a whole bunch of threads where people want to do exactly that,
e.g. grafana/grafana#6297
I have a metric which stores a datetime in epoch format. I would like to show this as a human-readable string in singlestat
The text was updated successfully, but these errors were encountered: