This issue was moved to a discussion.
You can continue the conversation there. Go to discussion →
Refresh interval per panel #3514
Comments
|
+1 |
|
How about per row refresh rate instead of per graph? |
|
First version done: Main interval is calculated to be the greatest common divisor and that's all. Pending last testing and create the pull request.
UPDATE: Ops, changing "Add refresh shift" by "Override refresh time" |


|
This is useful for CloudWatch to reduce cost. |
|
I've had to close pull request as there are many changes on master to keep it updated (test were failing as well). I'll try to implement again over latest version unless @torkelo you already have started this implementation. |
|
+1 |
|
I think this would be very useful for mixed content dashboards. I'd love to be able to mix some realtime-ish charts in with longer term trends. Any chance this could be revived ? |
|
+1, I really assumed Grafana would support something like this. |
|
Hope support row level, panel level refreshing! |
|
+1 this would be very helpful! |
|
+1 |
1 similar comment
|
+1 |
|
+1 this would greatly add to my Grafana <3 |
|
+1 |
1 similar comment
|
+1 |
|
Is it possible to stop posting the useless |
|
I'm surprised this was implemented 3 years ago but not released yet... Please upvote more :-) |
|
+1 |
|
@Edu-GM Please don't write +1, that is no help. Click the thumbs-up on the very first message in this issue, that will effectively upvote this issue. |
|
Please release this feature .. we need it to have a bit less load on the server. |
|
Hi everyone, |
|
Ok, done tested and working fine! (#16384)
UPDATE: |
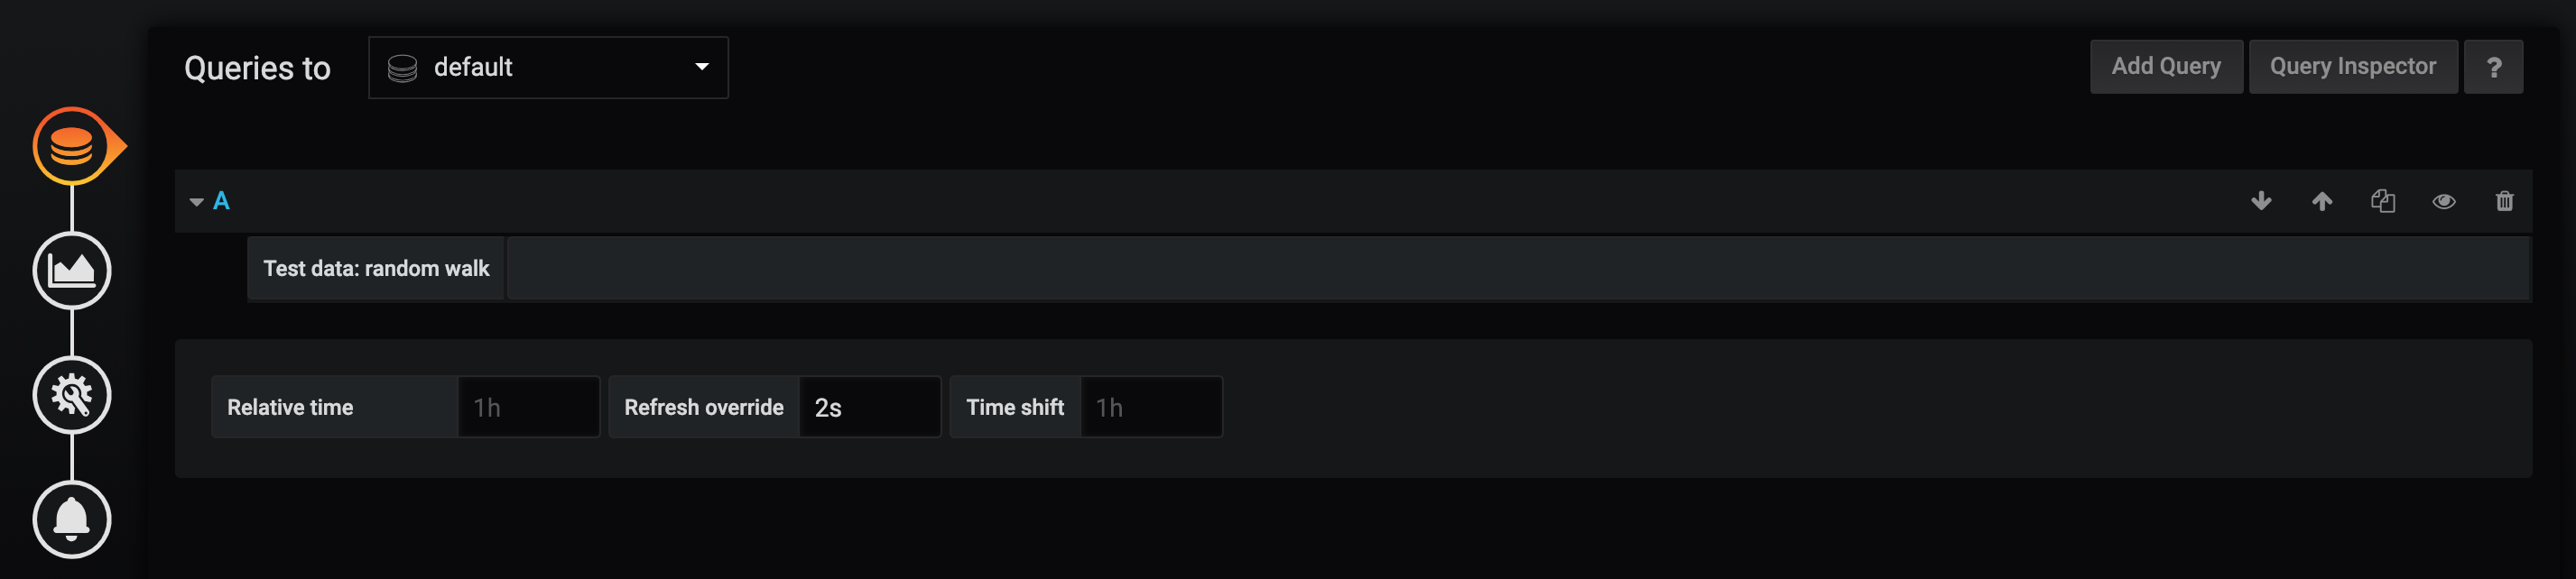
|
Ok, guess I have it done for the React panels 😓 |

|
I need this so much! |
|
can someone tell me how I can achieve different refresh intervals (by own coding or where can I find the panel from above) |
|
I think this feature would be great. Definitely need this. |
|
This would be a great feature for dashboards with multiple datasources 👍 |
|
I would love to have this feature ! 👍 |
|
This would be an amazing feature and its the only reason why I'm hesitant to start using this platform +1 |
|
Is there any update about this future? I'd like to see it in Grafana. |
|
@torkelo Any update? |
|
@torkelo Is this feature request anywhere on the current roadmap? |
|
no |
|
Why would it be? It's not like a tonne of people haven't wanted it for nearly 5 years now! ... oh wait.. |
Do you have some defined criteria to consider feature requests, so as to get this one qualified? |
|
@torkelo so maybe at least some protection that if previous refresh is not finished, it won't start another one. I have a few panels which took long to load and when I set refresh rate to 10s it is impossible for them to load, I need to manually change refresh rate to 1 minute so they load properly. |
|
Hi @torkelo , So this is a thought for all people here willing to have this, and other features, in Grafana: What if there's a fork adding this functionalities and offering the pull request to the main repository? Do you know if something like this exists?
Comments @torkelo ?, on your time. |
|
We accept pull requests for popular feature request if the implementation is sound and the added complexity is low enough compared to the added value |
|
👍 |
|
👍 |
This issue was moved to a discussion.
You can continue the conversation there. Go to discussion →
it would be useful specially now that there is elastic search and cloud watch backends to be able to set a per graph refresh i would like to have dashboards that will show a general overview some times over a week running pretty hard queries over in elastic search, but also showing some graph from other sources (like graphite or others db's) where i would like near realtime updates.
having real time updates on ES and cloud watch is really heavy on ES resources and cost's on aws but being able to override the refresh rate per graph would be really helpful.
The text was updated successfully, but these errors were encountered: