Skip to content
New issue

Have a question about this project? Sign up for a free GitHub account to open an issue and contact its maintainers and the community.

By clicking “Sign up for GitHub”, you agree to our terms of service and privacy statement. We’ll occasionally send you account related emails.

Already on GitHub? Sign in to your account

Unable to share Stackdriver dashboards between Google Projects anymore #23688

Closed
desolatorxxl opened this issue Apr 20, 2020 · 6 comments
Closed

Comments

@desolatorxxl
Copy link

In Grafana 6.7.2 it is not possible anymore to trivially share the same dashboards that use a Stackdriver datasource between multiple Grafana instances in different Google Cloud Projects.

When saving the dashboard to JSON, the Google Project will be saved in each panel. Using it via provisioning in another Google Cloud project will result in permission denied errors (which makes sense as it's trying to access the wrong project):

{ "error": { "code": 403, "message": "Permission monitoring.timeSeries.list denied (or the resource may not exist).", "status": "PERMISSION_DENIED" } }

For reference take a look at the projectName and labels fields in my gist: https://gist.github.com/desolatorxxl/fb45680918c12ab43d5830226ad32b91

Currently last known "good" version where this used to work is Grafana 6.4.4.
I believe the issue was introduced by #21002 or #22447.

How to reproduce it (as minimally and precisely as possible):

Grafana in Google Cloud project A:

  1. Create a Stackdriver datasource that will retrieve data from project A
  2. Create a dashboard
  3. Create a panel that uses the Stackdriver datasource inside the dashboard
  4. Save the dashboard to a JSON file
  5. Discard any dashboard changes
  6. Copy the JSON file into the dashboard provisioning path
  7. Observe that the dashboard gets created
  8. Observe that the panel displays data as expected

Grafana in Google Cloud project B:

  1. Create a Stackdriver datasource that will retrieve data from project B, with the same name as in Project A
  2. Copy the JSON file from project A into the dashboard provisioning path
  3. Observe that the dashboard gets created
  4. Observe that the panel can't get any data from Stackdriver

What you expected to happen:
I would expect the panels to work where the name of the configured datasource matches an existing Stackdriver datasource, as information about the Google Project is already present inside the datasource configuration.

Environment:

  • Grafana version: Grafana v6.7.2 (423a25f)
  • Data source type & version: Stackdriver 1.0
  • OS Grafana is installed on: Alpine Linux (Docker)
  • User OS & Browser: Linux & Vivaldi
  • Grafana plugins: There are no additional plugins installed
  • Others:
@marefr marefr added datasource/GoogleCloudMonitoring needs investigation for unconfirmed bugs. use type/bug for confirmed bugs, even if they "need" more investigating labels Apr 20, 2020
@marefr marefr added this to Inbox in Backend Platform Backlog via automation Apr 20, 2020
@marefr marefr added type/bug and removed needs investigation for unconfirmed bugs. use type/bug for confirmed bugs, even if they "need" more investigating labels Apr 22, 2020
@marefr marefr moved this from Inbox to Bugs in Backend Platform Backlog Apr 22, 2020
@marefr
Copy link
Member

marefr commented Apr 22, 2020

Workaround, I think you can use a template variable for project selection.

@desolatorxxl
Copy link
Author

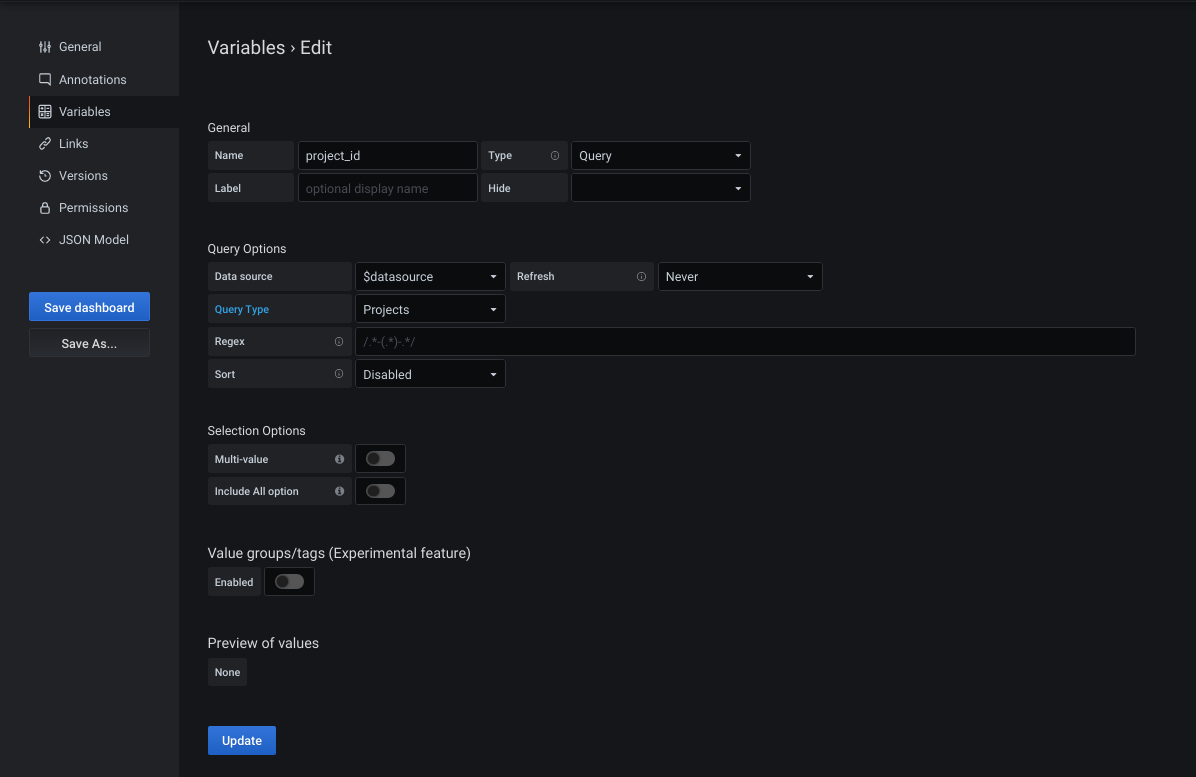
@marefr Thanks for your quick reply.

I just tried that and it works, however it leads me to another problem: How do I get the proper project ID into the variables value?

I will try to rename the datasource to resemble the project ID and use the variable type "Datasource" to retrieve the name of the stackdriver datasource as a value and use that as a query variable in the panel.
It's getting really complicated though.

@desolatorxxl
Copy link
Author

The solution proposed above isn't feasible because its really confusing to use.
I worked around with a rather unpleasant script to replace any incorrect project ID with the correct one in each JSON file before deploying them:

shopt -s globstar
for i in $dashboardsDir/**/*.json; do
    jq ".panels[]?.targets[]? |= if .projectName then .projectName = \"$googleProjectID\"  else . end" "$i" > "$i.tmp"
    mv "$i.tmp" "$i"
done

I really don't think saving the Google project ID in every stackdriver query is a good idea and I don't understand why this is the way it works now.
Maybe someone can explain it to me?

This also happens in Grafana 7.0.1.

@tomashejatko
Copy link

It looks like there is "Query type : projects" fort this purpose, but it is not working in Grafana 7.0.3

PR #22447 mentions Add a metric find query for projects so that the projects list can be used in template variables, which should be this, but it looks it is broken. See screenshot :
Screenshot from 2020-06-11 11-02-22

Can somebody confirm this?

@tomashejatko
Copy link

Hi,

I am here with more information after a long struggle with exporting and importing of Stackdriver dashboards

What I have mentioned in my previous comment (shown on screenshot) is actually issue #25487

What I have found related to this problem is #25373 - it already includes PR, but it will only resolve situations where projectName is not set

Just for context if anybody else will come here with problem sharing of Stackdriver Grafana dashboards between two Grafana instances :

When I've created dashboard in one Grafana instance, made export and imported into other Grafana instance (different Stackdriver project, bu also provisioned as default datasource), there were errors like {\n \"error\": {\n \"code\": 400,\n \"message\": \"Invalid project ID.\",\n \"status\": \"INVALID_ARGUMENT\"\n }\n}\n. I have tried to workaround it with creating templating variable named $project_id, which worked fine for graphs, but alert do not work with templated variables (#6557), so it began to throw similar errors, now with alerts :
t=2020-06-11T13:27:01+0000 lvl=eror msg="Alert Rule Result Error" logger=alerting.evalContext ruleId=1 name="CPU utilization alert" error="tsdb.HandleRequest() response error &{{\n \"error\": {\n \"code\": 400,\n \"message\": \"Invalid project ID.\",\n \"status\": \"INVALID_ARGUMENT\"\n }\n}\n A 0xc001164bb0 [] [] []}" changing state to=alerting

So with PR #25413 merged we will still need to something like (not tested) :

shopt -s globstar
for i in $dashboardsDir/**/*.json; do
    jq ".panels[]?.targets[]? |= if .projectName then del(.projectName) else . end" "$i" > "$i.tmp"
    mv "$i.tmp" "$i"
done

I agree with @desolatorxxl that saving the Google project ID in every stackdriver query is not good idea. At least, it is breaking our provisioning workflow.

@daniellee daniellee added this to To do in Cloud Datasources via automation Dec 1, 2020
@sunker sunker added the needs investigation for unconfirmed bugs. use type/bug for confirmed bugs, even if they "need" more investigating label Feb 3, 2021
@marefr marefr removed this from Bugs in Backend Platform Backlog Feb 8, 2021
@sunker sunker moved this from High priority bug to Low priority bug in [ARCHIVED] Cloud Datasources - Triage Feb 10, 2021
@vickyyyyyyy vickyyyyyyy added this to Needs Triage in [ARCHIVED] Cloud Datasources - Kanban via automation Jul 2, 2021
@vickyyyyyyy vickyyyyyyy moved this from Needs Triage to Backlog in [ARCHIVED] Cloud Datasources - Kanban Jul 7, 2021
@vickyyyyyyy vickyyyyyyy moved this from Backlog to Needs Triage in [ARCHIVED] Cloud Datasources - Kanban Nov 19, 2021
@iwysiu
Copy link
Contributor

iwysiu commented Nov 26, 2021

Hi! For the original issue, template variables can be used to share panels, as mentioned earlier in the thread. In regards to the alerts, we will not be changing that, as we're moving to unified alerting. Unified alerting separates alerts and the dashboards, making it impossible to use template variables.

@iwysiu iwysiu closed this as completed Nov 26, 2021
[ARCHIVED] Cloud Datasources - Kanban automation moved this from Needs Triage to Done Nov 26, 2021
@vickyyyyyyy vickyyyyyyy removed the needs investigation for unconfirmed bugs. use type/bug for confirmed bugs, even if they "need" more investigating label Nov 29, 2021
Sign up for free to join this conversation on GitHub. Already have an account? Sign in to comment
Development

No branches or pull requests

6 participants