Skip to content
New issue

Have a question about this project? Sign up for a free GitHub account to open an issue and contact its maintainers and the community.

By clicking “Sign up for GitHub”, you agree to our terms of service and privacy statement. We’ll occasionally send you account related emails.

Already on GitHub? Sign in to your account

Grafana Logs "database is locked" #16638

Open
lucas0530 opened this issue Apr 17, 2019 · 117 comments
Open

Grafana Logs "database is locked" #16638

lucas0530 opened this issue Apr 17, 2019 · 117 comments

Comments

@lucas0530
Copy link

What happened:
At some point, Grafana gets an error.
Log out with the error "database is locked."
The following are some of Grafana's logs:
lvl=eror msg="failed to look up user based on cookie" logger=context error="database is locked"

Environment:

  • Grafana version: grafana-6.1.4-1.x86_64
  • Data source type & version: postgresql 10.3, graphite 9.x
  • OS Grafana is installed on: Centos 6.9 amd64
  • User OS & Browser: ANY
  • Grafana plugins: piechart
  • Others:
@torkelo
Copy link
Member

torkelo commented Apr 17, 2019

Can you describe your setup more, options, number of users, alerts, dashboards, provisioned dashboards, alert evaluation frequency etc.

@seet61
Copy link

seet61 commented Apr 24, 2019

I have the same issue too.

t=2019-04-24T09:37:46+0300 lvl=eror msg="Could not load alerts" logger=alerting.ruleReader error="database is locked"
t=2019-04-24T09:37:46+0300 lvl=dbug msg="Scheduling update" logger=alerting.scheduler ruleCount=0
t=2019-04-24T09:37:55+0300 lvl=eror msg="Failed to get system stats" logger=metrics error="database is locked"
t=2019-04-24T09:37:56+0300 lvl=eror msg="Could not load alerts" logger=alerting.ruleReader error="database is locked"
t=2019-04-24T09:37:56+0300 lvl=dbug msg="Scheduling update" logger=alerting.scheduler ruleCount=0
t=2019-04-24T09:37:59+0300 lvl=dbug msg="auth token rotated" logger=auth affected=1 auth_token_id=46 userId=1
t=2019-04-24T09:37:59+0300 lvl=dbug msg="Updating last user_seen_at" logger=context userId=1 orgId=1 uname=admin user_id=1

Graphite, Grafana, Postgresql 9.6.

@marefr marefr added the needs more info Issue needs more information, like query results, dashboard or panel json, grafana version etc label Apr 24, 2019
@seet61
Copy link

seet61 commented Apr 26, 2019

Another services working correctly with the same db.

@marefr marefr added area/backend/db area/backend/db/sqlite type/bug and removed needs more info Issue needs more information, like query results, dashboard or panel json, grafana version etc labels Apr 26, 2019
@marefr marefr added this to the 6.2 milestone Apr 26, 2019
@bergquist bergquist modified the milestones: 6.2-beta1, 6.3 Apr 30, 2019
@cuxcrider
Copy link

I am having a similar issue using influxdb. Grafana works well for a while then all of sudden crashes and logs out. Grafana v6.1.6 (commit: cf9cb45), Ubuntu 16.04.

t=2019-05-14T00:36:04-0600 lvl=eror msg="Failed to get system stats" logger=metrics error="database is locked"
t=2019-05-14T00:36:05-0600 lvl=eror msg="Could not load alerts" logger=alerting.ruleReader error="database is locked"

@aggieben
Copy link

aggieben commented May 16, 2019

Same issue here. Running on an EC2 instance: prometheus, grafana, and a couple of my own services. Browser open to grafana, and that's it. No other services hitting grafana. Everything is fine for a few minutes, then at some point grafana craps itself with "database is locked" errors, and then it doesn't work, and it won't start back up.

@cuxcrider
Copy link

When it says "database" is locked, is it referring to the influxdb data source or to the grafana database which I believe contains information about the dashboard, settings, etc and is an SQLite database by default? I am running influxdb on a KVM VM and grafana on a separate KVM VM. It would be nice to know if I should be trying to tune influx or grafana.

@aggieben
Copy link

@cuxcrider This is a problem with grafana's default sqlite db.

@cuxcrider
Copy link

Any idea if switching to postgres or mysql solves the problem?

@aggieben
Copy link

No, and I don't really have any interest in that, because part of what I'm working on is zero-config (or near-zero-config) setup for dev environments. Having to configure a different DB as a backend is a non-starter for me.

@cuxcrider
Copy link

I hear ya there. Would much prefer it to just "work". I might give it a shot, I found some info here:
https://community.hortonworks.com/articles/33401/how-to-set-up-grafana-to-use-mysql-database-rather.html

@cuxcrider
Copy link

fyi I just set up grafana on a new VM and setup mysql using the guide I pasted above. I then exported my dashboards as JSON and inserted them into my new grafana and so far, so good. No crashing. You can maybe convert your SQLite to mysql if you have a ton of stuff already setup, but my grafana was pretty minimal so I just exported my dashboards as json and then manually reconnected to data sources.

@truealex81
Copy link

truealex81 commented May 17, 2019

I have similar issue when garafana suddenly stop working, and restarting doesn't fix this problem :(

t=2019-05-17T05:40:30+0000 lvl=eror msg="Could not load alerts" logger=alerting.ruleReader error="database is locked"
t=2019-05-17T05:40:40+0000 lvl=eror msg="Could not load alerts" logger=alerting.ruleReader error="database is locked"
t=2019-05-17T05:40:50+0000 lvl=eror msg="Could not load alerts" logger=alerting.ruleReader error="database is locked"
t=2019-05-17T05:40:59+0000 lvl=eror msg="failed to run garbage collect" logger=remotecache.database error="database is locked"
t=2019-05-17T05:40:59+0000 lvl=eror msg="Failed to get system stats" logger=metrics error="database is locked"
t=2019-05-17T05:41:00+0000 lvl=eror msg="Could not load alerts" logger=alerting.ruleReader error="database is locked"
t=2019-05-17T05:41:10+0000 lvl=eror msg="Could not load alerts" logger=alerting.ruleReader error="database is locked"
t=2019-05-17T05:41:20+0000 lvl=eror msg="Could not load alerts" logger=alerting.ruleReader error="database is locked"
t=20

@gsrcobr
Copy link

gsrcobr commented May 17, 2019

Same problem here.
Grafana 6.1.6
CentOS 6.9

t=2019-05-17T11:41:00-0300 lvl=eror msg="failed to look up user based on cookie" logger=context error="database is locked"

Starts to happen when upgraded to Grafana 6.

@psby
Copy link

psby commented May 18, 2019

I've got same issue.
Grafana send me 2 alerts tonight with Error message "Could not find datasource database is locked".

Grafana 6.1.6 @ Debian 4.9.168 in docker (image grafana/grafana:6.1.6)
InfluxDB

@kremers
Copy link

kremers commented May 20, 2019

Same issue here v.6.1.6

@DanCech
Copy link
Collaborator

DanCech commented May 21, 2019

This seems to be an issue with sqlite itself, one way to recover the sqlite databse is to follow the procedure here: https://community.grafana.com/t/database-is-locked-unable-to-use-grafana-anymore/16557/2

The “database is locked” error indicates a problem with your sqlite database. This can happen if the database is left in an inconsistent state after a crash, or if there are problems with the disk.

One thing you can try is to dump the data from your existing db file into a new one, then swap it out. From inside your Grafana data directory (after shutting down Grafana):

sqlite3 grafana.db '.clone grafana-new.db'
mv grafana.db grafana-old.db
mv grafana-new.db grafana.db

marefr added a commit that referenced this issue May 27, 2019
#17276)

Adds an additional sqlite error code 5 (SQLITE_BUSY) to the
transaction retry handler to add retries when sqlite
returns database is locked error.
More info: https://www.sqlite.org/rescode.html#busy

Ref #17247 #16638
@roidelapluie
Copy link
Collaborator

We have that a lot sinci grafana 6.2 (we use auth proxy)

@Umby79
Copy link

Umby79 commented Feb 28, 2022

I ran into the same issue while using app service in azure.

I solved the issue by changing the app planning parameter Capacity from 2 to 1.
That was causing the DB lock for me.

Hope this helps someone else too....

@DSalvigni
Copy link

I ran into the same issue while using app service in azure.

I solved the issue by changing the app planning parameter Capacity from 2 to 1. That was causing the DB lock for me.

Hope this helps someone else too....

WHere exactly it is this setting in app service???

@Umby79
Copy link

Umby79 commented Mar 1, 2022

I ran into the same issue while using app service in azure.
I solved the issue by changing the app planning parameter Capacity from 2 to 1. That was causing the DB lock for me.
Hope this helps someone else too....

WHere exactly it is this setting in app service???

Hi there,

It is in the "app service plan"
In the json file that I use to deploy it is called capacity:

        "sku": {
            "name": "P1v2",
            "tier": "PremiumV2",
            "size": "P1v2",
            "family": "Pv2",
            "capacity": 1

In the portal you can find this parameter under the app service plan menu-->settings-->properties.
There it is called "instance count". Not sure why the name is so different. I am new to Azure.

Just to be clear, you should also first change the connection string to:
connection_string=file:data/grafana.db?cache=private&mode=rwc&_journal_mode=WAL
and create the DB using the WAL mode as suggested in this same discussion.

However, for me it started to work only after I also change the capacity parameter as I mentioned.

Good luck and let me know if it is working

@Dhyanesh97
Copy link

image

We are also facing same issue. Error occurred for both cloud-watch (5 rules) and influx-db (25 rules) as data source.

Grafana 8.2.1
influxdb 2.0

rbarry82 added a commit to canonical/grafana-k8s-operator that referenced this issue Mar 22, 2022
Considering that is it not possible to `limit` the number of units
which may be started in a Juju application, it's possible for
more than one Grafana unit to be initialized. MOST of the data
which is present is propagated though libraries and across relation
interfaces as dashboards/datasources, but user interaction and
logins with the Grafana UI itself may result in changes.

Without a shared database, scaling the application up or down could
result in units with different administrative passwords, dashboards
imported from the marketplace, manually added users/groups, or more.

When a charm is elected as the leader, it will now start `litestream`
to serve changes over GRPC/HTTP. This additionally requires changing
the a sqlite pragma to Grafana. However, this is a long-requested
feature for Grafana itself, with hundreds of users reporting that
it actually reduced the frequency of database locking [see the
issue](grafana/grafana#16638), so this is
reasonably safe.
@Lithimlin
Copy link

Same issue here.

  • NixOS 21.11
  • Grafana 8.4.4
Mar 25 07:35:16 <host> grafana-start[33992]: logger=sqlstore t=2022-03-25T07:35:16.78+0100 lvl=eror msg="Failed getting data source" err="database is locked" uid=PAA5C29273E02624E id=0 name= orgId=1
Mar 25 07:35:18 <host> grafana-start[33992]: logger=sqlstore t=2022-03-25T07:35:17.89+0100 lvl=eror msg="Failed getting data source" err="database is locked" uid=PAA5C29273E02624E id=0 name= orgId=1
Mar 25 07:35:19 <host> grafana-start[33992]: logger=sqlstore t=2022-03-25T07:35:19+0100 lvl=eror msg="Failed getting data source" err="database is locked" uid=PAA5C29273E02624E id=0 name= orgId=1

This also causes various alerts to fire with no values. I have not yet found a pattern in which alerts will be affected.

@daverstam
Copy link

Indeed, I read the docs more thoroughly (which I should have done in the first place). They read:

Unlike the other journaling modes, PRAGMA journal_mode=WAL is persistent. If a process sets WAL mode, then closes and reopens the database, the database will come back in WAL mode. In contrast, if a process sets (for example) PRAGMA journal_mode=TRUNCATE and then closes and reopens the database will come back up in the default rollback mode of DELETE rather than the previous TRUNCATE setting.
The persistence of WAL mode means that applications can be converted to using SQLite in WAL mode without making any changes to the application itself. One has merely to run "PRAGMA journal_mode=WAL;" on the database file(s) using the command-line shell or other utility, then restart the application.
The WAL journal mode will be set on all connections to the same database file if it is set on any one connection.

My conclusions:

  • The connection_string method doesn't seem to work. Perhaps I did it wrong or it is obsolete, but from the logs it looks like Grafana doesn't find the existing DB file.
  • Setting WAL manually using sqlite3 should make the change permanent. Unless, I guess, Grafana explicitly specifies a different connection method on connection.

I just tried the sqlite3 method. I'll report here later on.

Jan 26 edit: I did that change on Jan 14th. The error seems to have disappeared since Jan 22nd. It's hard to conclude that it disappeared as a consequence of this change, as I can't explain the 8 days delay. I'll see if the problem reappears.

As I understand it setting wal in the db should be persistent and can't be changed by any application/connection.
"Unlike the other journaling modes, PRAGMA journal_mode=WAL is persistent."

@lafrech
Copy link

lafrech commented Apr 7, 2022

Yes, I was unclear. I meant the change is permanent indeed and it should apply (by default) to all new Grafana connections, unless Grafana explicitly specifies a different connection method (overriding this new permanent default).

BTW the issue never reappeared here so the sqlite3 method did the trick. I just can't explain why the issue persisted a few days after the fix.

@daverstam
Copy link

I just did the wal change and still get this in the logs:
logger=sqlstore t=2022-04-07T10:55:55.1+0200 lvl=info msg="Database locked, sleeping then retrying" error="database is locked" retry=0

I recently started to investigate if Grafana ngalert could be a contender to Alertmanager since I feel that Grafana has a nice UI however I'm running in to weird problems. One issue particular where all my alerts would get resolved and then a couple of minutes later gets in alert/firing mode again. I have the same alerts configured in Alertmanager and they stay in alert/firing mode there which is the correct state.

I'm suspecting this is caused by database locks but not sure really

@daverstam
Copy link

Update: It's now been 4days since I changed the DB to use wal and it seems to have solved the issue I had where all my alerts would suddenly get in resolved state.

I can still see this in the logs however it does not seem to affect anything since I don't have any issues.
logger=sqlstore t=2022-04-11T10:10:56.29+0200 lvl=info msg="Database locked, sleeping then retrying" error="database is locked" retry=0

@OleksNezhynskyi
Copy link

OleksNezhynskyi commented Apr 14, 2022

For a Grafana that deployed into Kubernetes cluster is not possible to execute 'sqlite3' command.
In this case, will help to add this into helm chart:
cache_mode: shared
in a database section

https://github.com/grafana/grafana/blob/main/conf/defaults.ini#L123

rbarry82 added a commit to canonical/grafana-k8s-operator that referenced this issue Aug 30, 2022
* Add sqlite streaming from primaries to secondaries

Considering that is it not possible to `limit` the number of units
which may be started in a Juju application, it's possible for
more than one Grafana unit to be initialized. MOST of the data
which is present is propagated though libraries and across relation
interfaces as dashboards/datasources, but user interaction and
logins with the Grafana UI itself may result in changes.

Without a shared database, scaling the application up or down could
result in units with different administrative passwords, dashboards
imported from the marketplace, manually added users/groups, or more.

When a charm is elected as the leader, it will now start `litestream`
to serve changes over GRPC/HTTP. This additionally requires changing
the a sqlite pragma to Grafana. However, this is a long-requested
feature for Grafana itself, with hundreds of users reporting that
it actually reduced the frequency of database locking [see the
issue](grafana/grafana#16638), so this is
reasonably safe.

* Update integration tests, fetch+push static sqlite so we can stay airgapped

* Add traefik v1, use litestream 0.4.0, update deployment doc

* Restructure leader arg/check, add comments about necessity of peer data change events

* Use a single password function for all units, since it's replicated

* Use the newest image

* Improve restart reliablility -- refresh dashboards faster, no need to restart; don't restart replicas on datasource change; force the types in _build_layer() to match the types from a running layer (Pebble should do this anyway, but does not)

* Update unit test

* Specify a refresh_event for prometheus with multiple containers, add unit tests, update integration tests action properties

* Add the litestream resource to the resource limits integration test, too

* Fix arg from merge

* Add a container poller

* Don't try to set peer data if we're not the leader
@kavaka123
Copy link

Any suggestions on how to fix this in k8s deployment?
I added the parameter "cache_mode: shared" like @k0ntrik said, and it worked for 5 days and started happening again. The error in logs is:
logger=sqlstore t=2022-12-04T10:10:56.29+0200 lvl=info msg="Database locked, sleeping then retrying" error="database is locked" retry=0

@strongpapazola
Copy link

image

@DLoT
Copy link

DLoT commented Jan 5, 2023

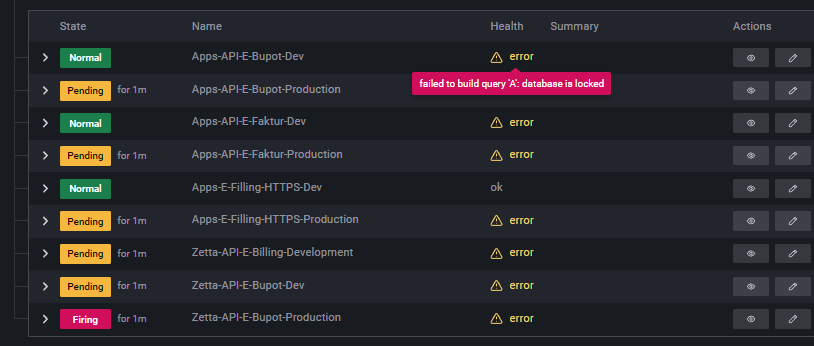
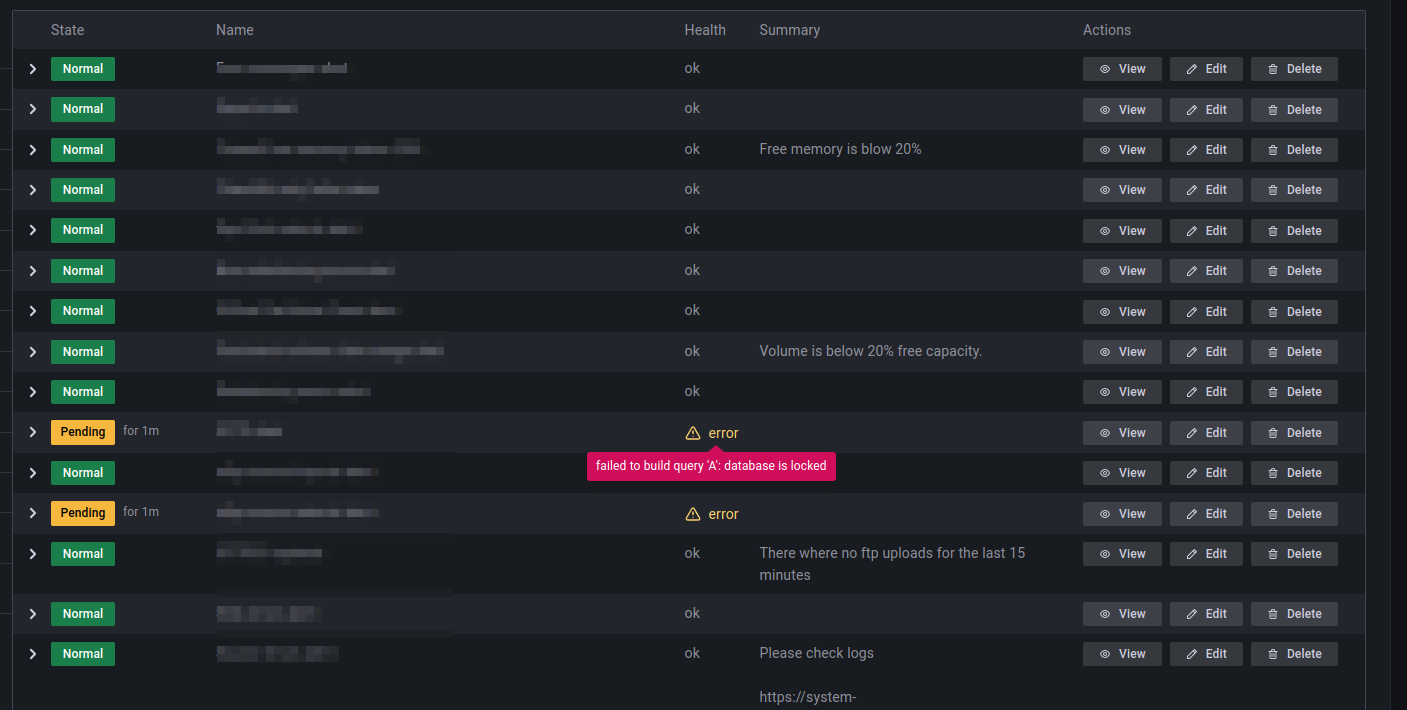
I have the same issue, happens on save but also on alert evaluation

Version is 9.3.2

logger=ngalert.scheduler rule_uid=aLHc4khVz org_id=1 version=3 attempt=0 now=2023-01-05T11:03:00Z t=2023-01-05T11:03:10.014606251Z level=error msg="Failed to build rule evaluator" error="failed to build query 'A': database is locked"

image

@jehutywong
Copy link

Version 9.3.6 is also faceing the same issue, when building alert rules with Prometheus datasource.

@ianmuge
Copy link

ianmuge commented Jan 31, 2023

I saw this command but didn't get the point.

So the process would be

stop grafana
backup db
sqlite3 grafana.db 'pragma journal_mode=wal;'
edit grafana.ini to add the connection_string line
restart grafana

I just tried that but got the same error. The error message about creating a database makes me think the connection_string is not interpreted correctly and grafana doesn't find my grafana.db.

This could be specific to my setup and I wouldn't like to send more noise to this issue. Yet I'm kinda stuck since I can't find much more about connection_string.

Hence my proposal to go on with #17912. It is old but the situation doesn't seem to have changed since then and the fix is not straightforward. At least not enough for me.

This seems to fix the issue on version 9.3.1

@marefr
Copy link
Member

marefr commented Jan 31, 2023

From Grafana v9.4.0 you'll be able to enable wal via config, https://grafana.com/docs/grafana/next/setup-grafana/configure-grafana/#wal

@LukasJerabek
Copy link

LukasJerabek commented Feb 1, 2023

Hi, I have got similar problem in postgresql 14 + timescaledb 2.9.1 with grafana 9.3.1.

Every midnight I get DatasourceError alerts (some repeats every day, others show occasionally, but it always happens at midnight). When examining the data, it does not look like there would be anything missing. However I once caught it exactly at midnight when I tried to run alert query and I have got this error in grafana window:
database is locked, dashboard query runner forbidden 403
I have also always find these in grafana.log:

logger=datasources t=2023-02-01T00:00:11.036218988+01:00 level=error msg="Failed getting data source" err="database is locked" uid=7uylVL07k id=0 name= orgId=1
logger=ngalert.scheduler rule_uid=A7JmCyOVk org_id=1 version=17 attempt=0 now=2023-02-01T00:00:00+01:00 t=2023-02-01T00:00:11.759236567+01:00 level=error msg="Failed to build rule evaluator" error="failed to build query 'A': database is locked"
logger=datasources t=2023-02-01T00:00:38.021860366+01:00 level=error msg="Failed getting data source" err="database is locked" uid=7uylVL07k id=0 name= orgId=1
logger=ngalert.scheduler rule_uid=0dM_9yOVz org_id=1 version=21 attempt=0 now=2023-02-01T00:00:00+01:00 t=2023-02-01T00:00:38.022852586+01:00 level=error msg="Failed to build rule evaluator" error="failed to build query 'A': database is locked"
logger=datasources t=2023-02-01T00:00:38.025806498+01:00 level=error msg="Failed getting data source" err="database is locked" uid=7uylVL07k id=0 name= orgId=1
logger=ngalert.scheduler rule_uid=FZizjydVz org_id=1 version=18 attempt=0 now=2023-02-01T00:00:00+01:00 t=2023-02-01T00:00:38.025876312+01:00 level=error msg="Failed to build rule evaluator" error="failed to build query 'A': database is locked"
logger=datasources t=2023-02-01T00:00:38.056431524+01:00 level=error msg="Failed getting data source" err="database is locked" uid=7uylVL07k id=0 name= orgId=1
logger=ngalert.scheduler rule_uid=mg-X2kK4k org_id=1 version=52 attempt=0 now=2023-02-01T00:00:00+01:00 t=2023-02-01T00:00:38.056540843+01:00 level=error msg="Failed to build rule evaluator" error="failed to build query 'A': database is locked"
logger=datasources t=2023-02-01T00:00:38.416748082+01:00 level=error msg="Failed getting data source" err="database is locked" uid=SEWMwHq7z id=0 name= orgId=1
logger=ngalert.scheduler rule_uid=m6gg1zKVz org_id=1 version=9 attempt=0 now=2023-02-01T00:00:00+01:00 t=2023-02-01T00:00:38.416899188+01:00 level=error msg="Failed to build rule evaluator" error="failed to build query 'A': database is locked"
logger=ngalert.multiorg.alertmanager t=2023-02-01T00:00:41.828170434+01:00 level=error msg="error while synchronizing Alertmanager orgs" error="database is locked"
logger=ngalert.scheduler rule_uid=gl9Jqwd4z org_id=1 version=63 attempt=0 now=2023-02-01T00:00:00+01:00 t=2023-02-01T00:00:50.682519118+01:00 level=error msg="Failed to evaluate rule" error="input data must be a wide series but got type long (input refid)" duration=0s
logger=ngalert.sender.router rule_uid=m6gg1zKVz org_id=1 t=2023-02-01T00:00:51.489028844+01:00 level=info msg="Sending alerts to local notifier" count=1
logger=ngalert.state.historian rule_uid=0dM_9yOVz org_id=1 t=2023-02-01T00:00:51.876814852+01:00 level=error msg="Error saving alert annotation batch" error="database is locked"

I was not sure if the issue is on timescaledb side or grafana, but I have noticed grafana has some troubles with this already.

@LukasJerabek
Copy link

Hi, I have got similar problem in postgresql 14 + timescaledb 2.9.1 with grafana 9.3.1.

Every midnight I get DatasourceError alerts (some repeats every day, others show occasionally, but it always happens at midnight). When examining the data, it does not look like there would be anything missing. However I once caught it exactly at midnight when I tried to run alert query and I have got this error in grafana window: database is locked, dashboard query runner forbidden 403 I have also always find these in grafana.log:

logger=datasources t=2023-02-01T00:00:11.036218988+01:00 level=error msg="Failed getting data source" err="database is locked" uid=7uylVL07k id=0 name= orgId=1
logger=ngalert.scheduler rule_uid=A7JmCyOVk org_id=1 version=17 attempt=0 now=2023-02-01T00:00:00+01:00 t=2023-02-01T00:00:11.759236567+01:00 level=error msg="Failed to build rule evaluator" error="failed to build query 'A': database is locked"
logger=datasources t=2023-02-01T00:00:38.021860366+01:00 level=error msg="Failed getting data source" err="database is locked" uid=7uylVL07k id=0 name= orgId=1
logger=ngalert.scheduler rule_uid=0dM_9yOVz org_id=1 version=21 attempt=0 now=2023-02-01T00:00:00+01:00 t=2023-02-01T00:00:38.022852586+01:00 level=error msg="Failed to build rule evaluator" error="failed to build query 'A': database is locked"
logger=datasources t=2023-02-01T00:00:38.025806498+01:00 level=error msg="Failed getting data source" err="database is locked" uid=7uylVL07k id=0 name= orgId=1
logger=ngalert.scheduler rule_uid=FZizjydVz org_id=1 version=18 attempt=0 now=2023-02-01T00:00:00+01:00 t=2023-02-01T00:00:38.025876312+01:00 level=error msg="Failed to build rule evaluator" error="failed to build query 'A': database is locked"
logger=datasources t=2023-02-01T00:00:38.056431524+01:00 level=error msg="Failed getting data source" err="database is locked" uid=7uylVL07k id=0 name= orgId=1
logger=ngalert.scheduler rule_uid=mg-X2kK4k org_id=1 version=52 attempt=0 now=2023-02-01T00:00:00+01:00 t=2023-02-01T00:00:38.056540843+01:00 level=error msg="Failed to build rule evaluator" error="failed to build query 'A': database is locked"
logger=datasources t=2023-02-01T00:00:38.416748082+01:00 level=error msg="Failed getting data source" err="database is locked" uid=SEWMwHq7z id=0 name= orgId=1
logger=ngalert.scheduler rule_uid=m6gg1zKVz org_id=1 version=9 attempt=0 now=2023-02-01T00:00:00+01:00 t=2023-02-01T00:00:38.416899188+01:00 level=error msg="Failed to build rule evaluator" error="failed to build query 'A': database is locked"
logger=ngalert.multiorg.alertmanager t=2023-02-01T00:00:41.828170434+01:00 level=error msg="error while synchronizing Alertmanager orgs" error="database is locked"
logger=ngalert.scheduler rule_uid=gl9Jqwd4z org_id=1 version=63 attempt=0 now=2023-02-01T00:00:00+01:00 t=2023-02-01T00:00:50.682519118+01:00 level=error msg="Failed to evaluate rule" error="input data must be a wide series but got type long (input refid)" duration=0s
logger=ngalert.sender.router rule_uid=m6gg1zKVz org_id=1 t=2023-02-01T00:00:51.489028844+01:00 level=info msg="Sending alerts to local notifier" count=1
logger=ngalert.state.historian rule_uid=0dM_9yOVz org_id=1 t=2023-02-01T00:00:51.876814852+01:00 level=error msg="Error saving alert annotation batch" error="database is locked"

I was not sure if the issue is on timescaledb side or grafana, but I have noticed grafana has some troubles with this already.

also solved by
sudo sqlite3 /var/lib/grafana/grafana.db 'pragma journal_mode=wal;'
Having ability to enable wal via config is a great idea. Thank you!

@slappey-ibkr
Copy link

Today we found majority of our dashboards somehow anonymously reverted to a previous version. Under version history, the Updated by field is blank and the Notes field is blank. It does not state "Restored from version xx". I had to manually go to every dashboard and restore from previous version. The only thing I could find in the logs were a few vague "database is locked" messages. What process could do this? I need to ensure this doesn't happen again.

@MiddleMan5
Copy link

We're also seeing a similar problem. Setting the wal configuration in the grafana settings does not seem to fix this issue

Environment:

  • Grafana v10.1.1 with ngalert and oncall plugin
  • sqlite3 with wal enabled
  • Periodic alerts that database is locked
  • Periodically unable to save dashboards due to error:
    logger=context userId=2 orgId=1 uname=quinn.mikelson@domain.com t=2023-10-04T17:56:13.449217515Z level=error msg="Failed to save dashboard" error="saving dashboard failed: database is locked" remote_addr=123.45.67.89 traceID=

image

@uluzox
Copy link

uluzox commented Dec 11, 2023

I had the same issue and found that my storage provider Azure File was not working with the Helm Chart. Switching to Azure Disk storage resolved the issue

@Oneoldmanz
Copy link

It's still relevant.
sudo sqlite3 /var/lib/grafana/grafana.db 'pragma journal_mode=wal' does not fix the situation.
Grafana v10.1.4 (a676a96)
endpoint telegram

@YourSandwich
Copy link

Same issue for me with the latest release

@shaunlowis
Copy link

At the time of writing this is still unresolved. I've got a samba server containing the grafana.db. I've mounted this and set up a dockerfile and docker-compose.yml. When I run this locally, it works fine and loads the grafana.db perfectly with docker-compose and also uses the grafana.ini file as expected. When I run this as a service in a docker swarm, I get the database locking issue.

A solution seems to be to migrate to postgreSQL, for which this tool exists: https://github.com/wbh1/grafana-sqlite-to-postgres
but isn't being maintained. Will attempt and report back.

@DanCech
Copy link
Collaborator

DanCech commented May 8, 2024

While WAL mode is helpful, it seems like the _busy_timeout parameter may also help alleviate the issues. It sets the sqlite busy timeout to the specified value, which will cause sqlite to retry transactions before giving up and returning the busy aka "database is locked" error.

You can set that and WAL mode (note that once you switch a given sqlite db to WAL mode you cannot switch back) via the following database config:

[database]
url = sqlite3://localhost?_busy_timeout=500
wal = true

Other sqlite-specific settings like path will continue to work as normal if you have your sqlite db in a non-standard location.

Sign up for free to join this conversation on GitHub. Already have an account? Sign in to comment
Projects
None yet
Development

No branches or pull requests