


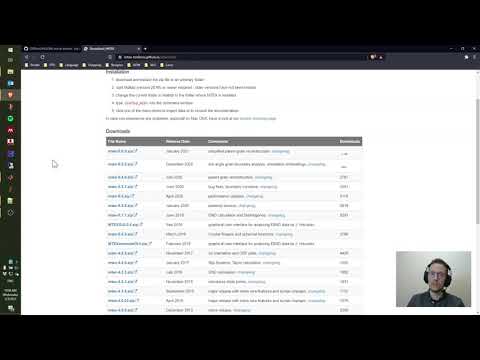
- The latest ORTools v2.3.0 stable release should be employed together with the MTEX v5.10 stable release.
- Alternatively, if you wish to use developer software, the latest versions of the ORTools and MTEX nightly builds should be employed together.


Orientation relationship tools (ORTools) is a function library for OR discovery, advanced OR analysis and the plotting of visually stunning and informative publication-ready figures particular to microstructures undergone partial/full martensitic transformation or OR-related phase transition.
The ORTools function library is written in MATLAB and is used as an add-on to the basic phase transformation functionalities within the MATLAB-based crystallographic toolbox MTEX. Due to their specific nature, the scripts contained in the ORTools library have not been included in MTEX. You may want to watch this talk by Frank Niessen at the 2021 MTEX Workshop for an introduction to the phase transformation features in MTEX and ORTools.
The advanced OR discovery, analysis and plotting functionalities of the ORTools library are highlighted in a series of example scripts that showcase how the functions work and what their output comprises.
To help maintain the ORTools library, please report any bugs you encounter in the discussions board. If you would like to contribute additional functionalities or wish to suggest new features that help improve it, please submit an issue or open a discussion.

A short introduction to ORTools

ORTools has been created by Dr Azdiar Gazder and Dr Frank Niessen.
Dr Tuomo Nyyssönen - Lath martensite block width calculator
If you have applied the OR discovery, OR and variant analyses, parent grain reconstruction, and correlated plotting features of MTEX and ORTools to your research, please cite this open-access paper as your reference:


- The ORTools library only works after the prior installation of MATLAB and MTEX.
- Click on the weblinks to download either one of the following two combinations:
- For instructions on installing MTEX and ORTools within MATLAB, please refer to the video given below.
- The peak fitting functionality within the function defineORs requires the prior installation of the MATLAB Signal Processing Toolbox.
- Open MATLAB and run one of the example files. Please refer to the Example 1 instruction video to learn how to run the examples. Alternatively, if you do not wish to run the example files and want to use the function library instead, please ensure that the ORTools root directory and all of its sub-directories are added to the MATLAB path.
- If you encounter any problems, please submit an issue or open a discussion.
- If you would like to contribute additional functionalities or wish to suggest new features, please submit a contribution or request a feature in the discussion.
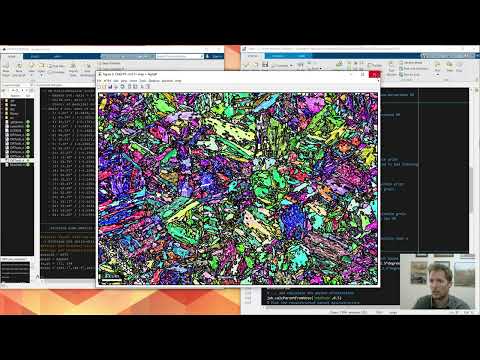
The world of martensitic transformation or phase transition analysis can be difficult to navigate. To help make the analysis accessible, transparent, and easy to comprehend, the ORTools library consists of plug-and-play functions. Example scripts are provided to help demonstrate these functions in action.
It is possible to run the example scripts from start to end, but we encourage you to run the example scripts in sections to understand the correlation between the scripts and the generated results. This will also help you follow the comments, which provide instructions on the various choices to make in the interactive parts of the program and/or help explain the obtained plots and results. In this way, you will learn the syntax applied throughout the scripts as well as the meaning behind the presented results.
Update to Example 1: Parent grain reconstruction using the variant graph approach in lath martensite and child grain id analysis
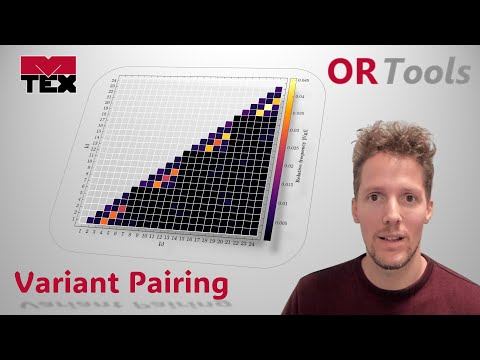
This script follows the same dataset as that used in the official MTEX example to demonstrate the reconstruction of parent gamma grains from child alpha grains in a lath martensite microstructure. The computeGrainPairs function provides a direct way of calculating the absolute or normalised frequency and boundary segment lengths of grain pairs. The grain pair ids can be defined by the user for variants, crystallographic packets, Bain groups, any other-id type or for groups of id or equivalent id pairs.
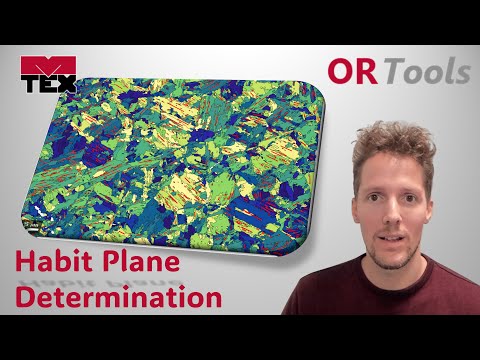
Update to Example 1: Parent grain reconstruction using the variant graph approach in lath martensite and habit plane determination
This script follows the same dataset as that used in the official MTEX example to demonstrate the reconstruction of parent gamma grains from child alpha grains in a lath martensite microstructure. The computeHabitPlane function provides a direct way of calculating the habit plane compared to conventional MTEX.
The details related to the habit plane calculation are described in the following paper:
Update to Example 2: Parent grain reconstruction using the variant graph approach in Ti alloys
This script follows the same dataset as that used in the official MTEX example to demonstrate the reconstruction of parent beta grains from child alpha grains in a alpha-beta Ti alloy. The script provides a faster and less involved way of reconstructing this microstructure compared to the triple-point based approach from Example 2.
The details related to the variant graph approach are described in the following paper:
Update to Example 1: Parent grain reconstruction using the new variant graph approach and advanced variant analysis in lath martensitic steel
This script follows the same dataset as that used in the official MTEX example to demonstrate the reconstruction of parent austenite grains from child lath martensite using the new variant graph approach. Compared to the original Example 1, this updated version also features equivalent variant pair analysis and the measurement of lath block widths.
The details related to the variant graph approach are described in the following paper:
Example 7 - Variant graph approach & advanced variant analysis in lath martensitic steel
Two-stage parent grain reconstruction in a TWIP-TRIP steel
This example is of a 10% cold-rolled twinning and transformation induced plasticity (TWIP-TRIP) steel microstructure with a two-step martensitic transformation in which ε martensite formed from γ austenite, and α' martensite formed from ε martensite. ORTools and the MTEX parent grain reconstruction functionalities are used to reconstruct both parent microstructures in a single workflow. Towards the end, it is demonstrated that variant analysis can be conducted on both transformations.
EBSD map courtesy: Pramanik et al. https://doi.org/10.1016/j.msea.2018.06.024
Example 6 - Two-stage parent grain reconstruction in a TWIP-TRIP steel
Partial parent grain reconstruction to clean TWIP-TRIP steel EBSD data
This example is of a 20% cold-rolled twinning and transformation induced plasticity (TWIP-TRIP) steel microstructure presenting with a two-step martensitic transformation in which ε martensite formed from γ austenite, and α' martensite formed from ε martensite. Using the OR peak fitter function, it is discovered that two possible ORs could be in operation for the γ to α' microstructure. The first OR is not a real OR but rather, an "apparent" OR corresponding to pixels that were misindexed as α' during map acquisition even though they notionally belong to γ. The parent phase reconstruction features in MTEX and the "apparent" OR are used to revert these misindexed points to γ. The grain calculation and the OR peak fitter is re-run to show that the "apparent" OR was eliminated.
EBSD map courtesy: Pramanik et al. https://doi.org/10.1016/j.msea.2018.06.024
Example 5 - Partial parent grain reconstruction to clean TRIP-TWIP steel EBSD map data
Predicting the β to α transformation texture in a titanium alloy
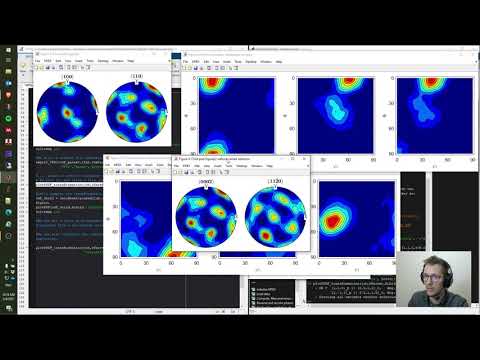
In this script, the reconstruction of the prior parent β microstructure from a child α microstructure is repeated as shown in example 2. Examination of the variant distribution shows that strongly preferential variant selection did not occur. Therefore, the transition texture of α can be accurately predicted from the reconstructed β using the plotPODF_transform function. The result shows that the predicted α transition texture is in good agreement with the experimental α texture.
Example 4 - Transformation texture prediction in titanium alloys
Using the OR peak fitter to deconvolute multiple ORs in titanium alloys
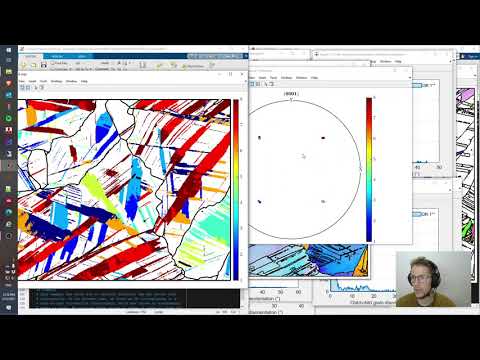
In example 2 the α-β Ti microstructure showed two ORs in the OR peak fitter function. In this example, both ORs are investigated to find out which one of them dominated the phase transition. To evaluate the best match, the disorientation between grain boundary misorientations and the OR misorientations in inverse pole figures and on boundary maps are plotted.
Parent grain reconstruction and variant analysis in titanium alloys
This script follows the same dataset and steps that are used to demonstrate the reconstruction of β grains from an α microstructure in the official MTEX example for phase transitions in titanium alloys. Here the OR peak fitter function is used to determine the OR from alpha-beta boundaries even though they only make up < 1% of all boundaries in the dataset. Advanced plotting functions are employed to produce publication-ready plots.
Parent grain reconstruction and variant analysis in lath martensitic steel
This script follows the same dataset and steps that are used to demonstrate the reconstruction of austenitic parent grains from martensite grains using the grain graph approach in the official MTEX example for martensite transformation in steels. The functionality of ORTools in providing pre-written and additional plotting functions to create publication-ready plots is demonstrated.
C
computeBainGrains
This function computes the Bain group IDs of child grains.
- Syntax
- [bain_grains] = computeBainGrains(job)
- Input
- job - @parentGrainReconstructor
- Output
- bain_grains - @grains2d
- Syntax
computeGrains
This function is a GUI to compute grains from ebsd map data and optionally filters them.
- Syntax
- [ebsd,grains,gB] = computeGrains(ebsd)
- Input
- ebsd - @EBSD
- Output
- ebsd - @EBSD
- grains - @grains2d
- gB - @grainBoundary

- Syntax
computeGrainPairs
This function computes the absolute or normalised frequency and boundary segment lengths of grain pairs. The grain pair ids can be defined by the user for variants, crystallographic packets, Bain groups, any other-id type or for groups of id or equivalent id pairs.
-
Syntax:
- [out] = computeGrainPairs(grains)
-
Input:
- pairGrains - @grain2d = child grain pairs as computed by the computeVariantGrains function
-
Output:
- out - @struc = a strcture variable containing the absolute or normalised frequency and boundary segment lengths of grain pairs.
-
Options:
- variant - Uses the variant ids of child grain pairs.
- packet - Uses the packet ids of child grain pairs.
- bain - Uses the bain ids of child grain pairs.
- other - Uses a pre-specified list of ids of child grain pairs.
- group - A cell defining different groups of id or equivalent id pairs.
- include - Includes similar neighbouring variant, packet, bain, other-id type, groups of id or equivalent id pairs. For e.g. - V1-V1, or CP2-CP2, or B3-B3 etc.
- exclude - Excludes similar neighbouring variant, packet, bain, other-id type, groups of id or equivalent id pairs. (default)
- absolute - Returns the absolute frequency and boundary segment values of neighbouring variant, packet, bain, other-id type, or groups of id or equivalent id pairs.
- normalise - Returns the normalised frequency and boundary segment values of neighbouring variant, packet, bain, other-id type, groups of id or equivalent id pairs. (default)
-
computeHabitPlane
This function computes the habit plane based on the determined traces from 2D ebsd map data as per the following reference:
- Syntax
- [hPlane,statistics] = computeHabitPlane(job)
- Input
- job - @parentGrainReconstructor
- Output
- hPlane - @Miller = Habit plane
- statistics - @Container = Statistics of fitting
- Options
- Radon - Radon based algorithm (ebsd pixel data used)
- Fourier - Fourier based algorithm (ebsd pixel data used)
- Calliper - Shortest calliper based algorithm (grain data used)
- Shape - Characteristic grain shape based algorithm (grain data used)
- Hist - Circular histogram based algorithm (grain data used)
- minClusterSize - Minimum number of pixels required for trace determination (default = 100)
- reliability - Minimum value of accuracy in determined traces used to compute the habit plane (varies from 0 to 1, default = 0.5)
- colormap - Defines the colormap to display the variants (default = haline)
- linecolor - Defines the linecolor of the plotted traces (default = red)
- noScalebar - Remove scalebar from maps
- noFrame - Remove frame around maps
- plotTraces - Logical used to plot the trace & habit plane output

- Syntax
computePacketGrains
This function computes the crystallographic packet IDs of child grains.
- Syntax
- [packet_grains] = computePacketGrains(job)
- Input
- job - @parentGrainReconstructor
- Output
- packet_grains - @grains2d
- Syntax
computeParentTwins
This function computes twins in parent grains by local refinement.
- Syntax
- computeParentTwins(job,pGrainId)
- Input
- job - @parentGrainreconstructor
- pGrainId - parent grain Id
- direction - @vector3d
- Options
- grains - plot grain data instead of EBSD data

- Syntax
computeVariantGrains
This function refines the child grains in the job object based on their variant IDs. It returns a grain object containing the refined child grains alongside all other grains and an EBSD object with updated grain Ids.
- Syntax
- [variant_grains,cEBSD] = computeVariantGrains(job,varargin)
- Input
- job - @parentGrainReconstructor
- Output
- grains - @grains2d
- ebsd - @EBSD
- Options
- parentGrainId - parent grain Id using the argument 'parentGrainId'
- Syntax


D
defineORs
-
Parallel planes and directions in a GUI, or
-
Peakfitting of the parent-child boundary misorientation angle distribution.
-
Syntax
- job = defineORs(job)
-
Input
- job - @parentGrainReconstructor
-
Output
- job - @parentGrainReconstructor
This auxiliary function defines an orientation relationship (OR) for a parent-child phase combination given in the job object as:
F
fibreMaker
This function creates an ideal crystallographic fibre with a user specified half-width and exports the data as:
-
a lossless Mtex .txt file for MTEX v5.9.0 and onwards), or
-
a lossy discretised Mtex .txt file for MTEX up to v5.8.2) for later use.
-
Syntax
- fibreMaker(crystalDirection,specimenDirection)
-
Input
- crystalDirection - @Miller
- sampleDirection - @vector3d
- sampleSymmetry - @specimenSymmetry
-
Options
- halfwidth - halfwidth for the ODF calculation
- export - (optional path and) name of the file
-
G
grainClick
This function produces a figure of an interactive ebsd map. It enables users to click on individual parent grains for detailed variant analysis.
- Syntax
- grainClick(job)
- Input
- job - @parentGrainReconstructor
- direction - @vector3d
- Options
- parentTwins - Refine grains to detect parent twins
- grains - Plot grain data instead of EBSD data
- noScalebar - Remove scalebar from maps
- noFrame - Remove frame around maps

- Syntax
guiOR
This function is a GUI to to define an orientation relationship (OR) with parallel planes and directions.
- Syntax
- p2c = guiOR(job)
- Input
- job - @parentGrainReconstructor
- Output
- p2c - parent to child misorientation

- Syntax


O
orientationMaker
This function creates an ideal crystallographic orientation from a unimodal ODF with a user specified half-width and exports the data as a lossless Mtex .txt file for later use.
- Syntax
- orientationMaker(ori)
- Input
- ori - @orientation
- sampleSymmetry - @specimenSymmetry
- Options
- halfwidth - halfwidth for the odf calculation
- export - (optional path and) name of the file
- Syntax
ORInfo
The function extracts orientation relationship (OR) information contained in the job.p2c structure variable and outputs it in the MATLAB command window.
- Syntax
- ORinfo(p2c)
- Input
- p2c - parent to child misorientation
- Output
- OR - structure containing OR information
- Options
- silent - suppress command window output

- Syntax

P
peakFitORs
This function peak fits parent-child misorientation angle ranges to determine one or several orientation relationships (ORs). The function is called by defineORs.
- Syntax
- p2c = peakFitORs(job,misoRange)
- Input
- job - @parentGrainReconstructor
- misoRange - range of misorientation angles in which to fit
- Output
- p2c - parent to child misorientation

- Syntax
plotHist_OR_misfit
This function plots the disorientation, (or misfit), between parent-child and child-child grains and an orientation relationship (OR) in a histogram. By default, the current OR (job.p2c) is selected and is denoted by 2 stars (**). Additional ORs can be supplied with the argument p2c.
- Syntax
- plotHist_OR_misfit(job)
- plotHist_OR_misfit(job,p2c)
- Input
- job - @parentGrainReconstructor
- p2c - one or multiple additional orientation relationship(s) to evaluate
- Options
- bins - number of histogram bins
- legend - cell array of strings with legend names of ORs to evaluate

- Syntax
plotIPDF_gB_misfit
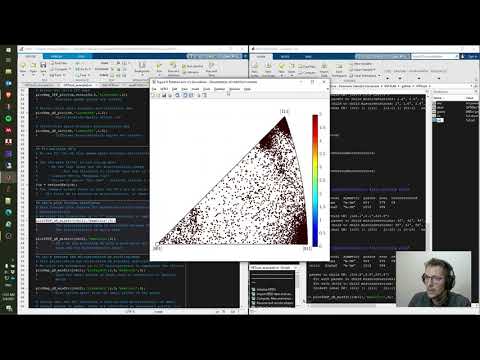
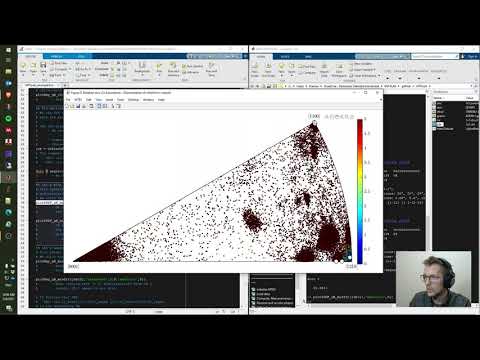
This function plots the misfit, or disorientation, between parent-child and child-child boundaries sharing an orientation relationship (OR) in an inverse pole figure (IPF) showing the misorientation axes.
- Syntax
- plotIPDF_gB_misfit(job)
- Input
- job - @parentGrainReconstructor
- Options
- colormapP - colormap variable for parent grains
- colormapC - colormap variable for child grains
- maxColor - maximum color on color range [degree]

- Syntax
plotIPDF_gB_prob
This function calculates and plots the probability distribution, between 0 and 1, that a boundary belongs to an orientation relationship (OR) in an inverse pole figure (IPF) showing the misorientation axes.
- Syntax
- plotIPDF_gB_prob(job)
- Input
- job - @parentGrainReconstructor
- Options
- colormap - colormap variable

- Syntax
plotMap_bain
This function plots an ebsd map by colorising child grains according to their Bain group ID. It also outputs the area fraction of each Bain group.
- Syntax
- plotMap_bain(job)
- Input
- job - @parentGrainreconstructor
- Output
- f_area: Area fraction of each Bain group in the EBSD map
- Options
- colormap - colormap variable
- grains - plot grain data instead of EBSD data

- Syntax
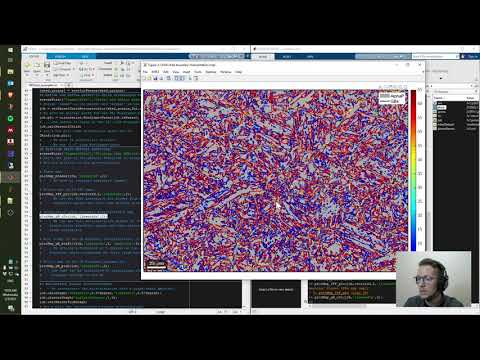
plotMap_blockWidths
This function calculates and plots an ebsd map of the representative value for martensite block widths by projecting all boundary points to the vector perpendicular to the trace of the {111}a plane as per the following reference:
Contributed by Dr. Tuomo Nyyssönen
- Syntax
- plotMap_blockWidths(job,varargin)
- Input
- job - @parentGrainreconstructor
- pGrainId - parent grain Id using the argument 'parentGrainId'
- Options
- noScalebar - Remove scalebar from maps
- noFrame - Remove frame around maps

- Syntax
plotMap_clusters
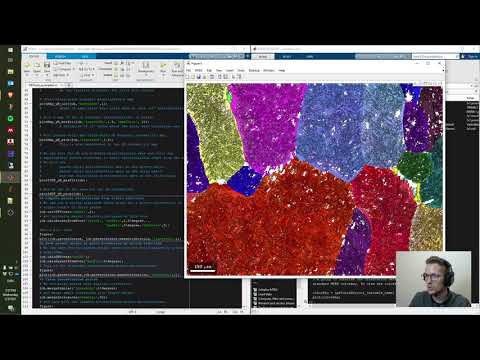
This function plots an ebsd map of child grain clusters that are likely to belong to the same parent grain when clusterGraph is called. It is displayed as an overlay on top of a semi-transparent IPF map of child grains.
- Syntax
- ipfKey = plotMap_clusters(job)
- ipfKey = plotMap_clusters(job,direction)
- Input
- job - @parentGrainReconstructor
- direction - @vector3d - IPF direction

- Syntax
plotMap_gB_c2c
This function plots an ebsd map by colorising child-child boundary misorientations contained in the variable job.
- Syntax
- plotMap_gB_c2c(job)
- Input
- job - @parentGrainReconstructor
- Options
- colormap - colormap variable

- Syntax
plotMap_gB_misfit
This function plots an ebsd map by colorising the misfit, or disorientation, between parent-child and child-child boundaries with the orientation relationship (OR) job.p2c
- Syntax
- plotMap_gB_misfit(job)
- Input
- job - @parentGrainReconstructor
- Options
- colormap - colormap variable

- Syntax
plotMap_gB_p2c
This function plots an ebsd map by colorising child-child boundary misorientations contained in the variable job.
- Syntax
- plotMap_gB_p2c(job)
- Input
- job - @parentGrainReconstructor
- Options
- colormap - colormap variable

- Syntax
plotMap_gB_prob
This function calculates and plots an ebsd map of the probability distribution, between 0 and 1, that a boundary belongs to an orientation relationship (OR). For more details, please click here.
- Syntax
- plotMap_gB_prob(job)
- Input
- job - @parentGrainReconstructor
- Options
- threshold - the misfit at which the probability is exactly 50 percent ...
- tolerance - ... and the standard deviation in a cumulative Gaussian distribution
- colormap - colormap variable

- Syntax
plotMap_IPF_p2c
This function plots inverse pole figure maps of the parent and child phases and returns the ipfHSV color key.
- Syntax
- plotMap_IPF_p2c(job)
- plotMap_IPF_p2c(job, direction)
- Input
- job - @parentGrainReconstructor
- direction - @vector3d
- Output
- ipfKey - @ipfHSVKey
- Options
- parent - plot only map of parent phase
- child - plot only map of child phase

- Syntax
plotMap_packets
This function plots an ebsd map by colorising child grains according to their crystallographic packet ID. It also outputs the area fraction of each crystallographic packet.
- Syntax
- plotMap_packets(job)
- Input
- job - @parentGrainReconstructor
- Options
- colormap - colormap variable
- grains - Plot grain data instead of EBSD data

- Syntax
plotMap_phases
This function plots an ebsd map of the grain phases in the job variable as well as the grain boundaries (job.grains.boundary).
- Syntax
- p2c = plotMap_phases(job)
- Input
- job - @parentGrainReconstructor

- Syntax
plotMap_variantPairs
This function plots an ebsd map of the equivalent pairs of martensitic variants (block boundaries) in steel microstructures as per the analysis in the following reference:
- Syntax
- variantPairs_boundary = plotMap_variantPairs(job,varargin)
- Input
- job - @parentGrainreconstructor
- pGrainId - parent grain Id using the argument 'parentGrainId'
- Output
- variantPairs_boundary - a structure variable of the groups of equivalent variant pair boundaries
- Options
- noScalebar - Remove scalebar from maps
- noFrame - Remove frame around maps

- Syntax
plotMap_variants
This function plots an ebsd map by colorising child grains according to their variant IDs. It also outputs the area fraction of each variant.
The function plots the map of child grains colored according to their variant ID.
- Syntax
- plotMap_variants(job)
- Input
- job - @parentGrainReconstructor
- Options
- colormap - colormap variable
- grains - Plot grain data instead of EBSD data

- Syntax
plotPDF_bain
This function plots a pole figure of the child Bain group IDs associated with an OR job.p2c.
- Syntax
- plotPDF_bain(job)
- plotPDF_bain(job,oriParent)
- plotPDF_bain(job,oriParent,pdf)
- Input
- job - @parentGrainreconstructor
- oriParent - @orientation
- pdf - @Miller
- Options
- colormap - colormap variable

- Syntax
plotPDF_packets
This function plots a pole figure of the child crystallographic packet IDs associated with an OR job.p2c.
- Syntax
- plotPDF_packets(job)
- plotPDF_packets(job, oriParent)
- plotPDF_packets(job, oriParent, pdf)
- Input
- job - @parentGrainReconstructor
- oriParent - @orientation
- pdf - @Miller
- Options
- colormap - colormap variable
- markersize - markersize

- Syntax
plotPDF_variants
This function plots a pole figure of the child variant IDs associated with an OR job.p2c. It is an alternative to MTEX's default plotVariantPF.
- Syntax
- plotPDF_variants(job)
- plotPDF_variants(job, oriParent)
- plotPDF_variants(job, oriParent, pdf)
- Input
- job - @parentGrainReconstructor
- oriParent - @orientation
- pdf - @Miller
- Options
- colormap - colormap variable
- markersize - markersize

- Syntax
plotPODF_transform
The function calculates and plots the transformation texture, with or without imposing variant selection, based on a parent texture file. Input files can be created using:
-
ebsd map data as shown in example 4,
-
fibreMaker, or
-
Syntax
- plotPODF_transformation(job,hParent,hChild)
-
Input
- hParent - @Miller (parent pole figures to display)
- hChild - @Miller (child pole figures to display)
-
Options
- odfSecP - array with angles of parent ODF section to display
- odfSecC - array with angles of child ODF section to display
- colormapP - colormap variable for parent PFs and ODFs
- colormapC - colormap variable for child PFs and ODFs
- variantId - list of specific variant Ids to plot
- variantWt - list of specific variant weights to plot
- halfwidth - halfwidth for PF calculation & display
- import - (optional path) & name of the input *.mat file to transform
- export - (optional path) & name of the output transformed *.mat file

-
plotStack
This function plots a series of maps, figures, graphs, and tables for detailed child variant analysis within a single parent grain as follows:
-
By manually supplying a parentGrainId, or
-
Using the grainClick function and interactively choosing a grain of interest.
-
Syntax
- plotStack(job,pGrainId)
-
Input
- job - @parentGrainreconstructor
- pGrainId - parent grain Id
- direction - @vector3d
-
Options
- grains - Plot grain data instead of EBSD data
- noScalebar - Remove scalebar from maps
- noFrame - Remove frame around maps

-


R
readCPR
This function is a GUI to interactively load .cpr and .crc ebsd map data files into MTEX.
- Syntax
- ebsd = readCPR
- ebsd = readCPR(inPath)
- ebsd = readCPR(inPath, fileName)
- Input
- inPath - string with path to directory 'xx\yy\zz'
- fileName - string with filename 'xxyyzz.cpr'
- Output
- ebsd - @EBSD
- Syntax
recolorPhases
This function is a GUI to interactively recolor phases in the ebsd or grains variables.
- Syntax
- [ebsd] = recolorPhases(ebsd)
- [grains] = recolorPhases(grains)
- Input
- ebsd - @EBSD
- grains - @grains2d
- Output
- ebsd - @EBSD
- grains - @grains2d

- Syntax
renamePhases
This function is a GUI to interactively rename phases. It opens a list of phase names (pre-defined in phaseStrings) and renames each phase in the ebsd variable according to a user's selection.
- Syntax
- ebsd = renamePhases(ebsd,phStr)
- Input
- ebsd - @EBSD
- phaseStrings - cell array of strings with possible phase names
- Output
- ebsd - @EBSD
- Syntax

S
saveImage
This function saves all open figures as images.
- Syntax
- saveImage(fileDir,fileName)
- saveImage(fileDir)
- saveImage
- Input
- fileName - file name (string with file of type * .bmp, * .jpeg, * .png or * .tiff )
- fileDir - file directory
- Syntax
screenPrint
This function formats command window output.
- Syntax
- screenPrint(mode)
- screenPrint(mode, string)
- Input
- mode - formatting mode
- string - output string
- Syntax
setInterp2Latex
This function changes all MATLAB text interpreters from 'tex' to 'latex in all subsequent figures, plots, and graphs.
- Syntax
- setInterp2Latex
- Syntax
setInterp2Tex
This function changes all MATLAB text interpreters from 'latex' to 'tex in all subsequent figures, plots, and graphs.
- Syntax
- setInterp2Tex
- Syntax
setParentGrainReconstructor
This function is a GUI to define a job of class parentGrainReconstructor.
- Syntax
- setParentGrainReconstructor(ebsd,grains)
- setParentGrainReconstructor(ebsd,grains,inPath)
- Input
- ebsd - @EBSD
- grains - @grain2d
- inPath - string giving path to * .cif file folder
- Output
- job - @parentGrainReconstructor
- Syntax
T
tileFigures
This function tiles all figures evenly across the computer screen/monitor.
- Syntax
- fileFigs
- Syntax