Performance loss between versions 2.X and 3.X #18974
Comments
|
After a few runs in Chrome 81 on my machine I got: 2.18 best time: 283ms That was running it with the DevTools closed. Then I converted the 3.18 twiddle to Ember Octane by:
After that the best time I got from 3.18.1 was 276ms, so a meaningful improvement in line with the 2.18 number. These performance tests weren't particularly scientific though, and I haven't investigated which change was the most important in terms of performance. |
|
Profiling in a twiddle is pretty error prone, can we port to a normal ember-cli app repo (using a branch for each of the two versions) to profile against? |
|
@rwjblue I am getting the same results on a normal ember-cli app. Can be tested here @richard-viney There may be improvements to consider but problem is that no deprecated code used in both versions and experiencing a performance loss seems unacceptable.
|
|
@barisnisanci Agreed, I wasn't meaning to suggest that this kind of refactoring should be necessary in order to avoid significant performance regressions when upgrading. It was an experiment to see if there was any impact from using the modern conventions, as that might help isolate the problem and/or allow it to be worked around if needed. It would be interesting to know which Ember release(s) introduced the performance regression by also testing the intervening LTS versions, i.e. 3.4, 3.8, 3.12, and 3.16. |
|
@barisnisanci Ember Twiddle and I downloaded your example and served both 2.8 and 3.18 side by side in production mode. What I found was that it seems like you may be correct, on average the timing between the two helper operations (which is what is being measured here) seems larger in 3.18 than it was in 2.8. That is based on me taking a few samples on my work laptop without many controls, so it's hard to say for sure, but eyeballing it, it could be a slight change. However, looking at other more meaningful metrics, I'm not seeing a change. Specifically looking at the overall time to render content, they look about the same in general. Time to First Paint is about the same, for instance.
It's important to keep in mind that we have a lot of work spread out in a lot of places, and when we make changes, sometimes that work moves around but doesn't affect the overall metrics. This is why we use TracerBench to check for performance changes, because it's designed to consider the overall phases of render and to account for all changes at a macro level, rather than a micro level, like the timing between helpers running. We should probably try to do a TracerBench test soon over a longer time period, just to verify these findings and to make sure we haven't slipped in general (we typically use it for smaller changes where we expect potential regressions). We should also just try to get it running at regular intervals, so we can see the trend line. |
|
@pzuraq Just updated the repository with
Also noticed that JS Heap never released in 3.18 but maybe some bad luck on GC. I can add style bindings, service injections, more heavy computations on components instead of increasing counts however they may shadow the underlying issue. Just like you mentioned overall metrics are way important than minor changes. However minor differences adds up to a major performance drop in our case. Our commercial application initial render time increased from 15 seconds to 20 seconds after upgrading to 3.18. Hopefully you will consider regression in terms of percentage rather than slight milisecond changes. |
|
Our company is suffering from this problem. We updated ember version from 2.18 to 3.16. then our render times became longer more than '50' percent. When we use complicated structures, the difference between render times became more obvious rather than slight milisecond changes. Any updates on this issue? We have benchmarks showing %50 increase in render time. Decided to hold on to 2.18 for the time being. We may consider switching frameworks if it will require a major refactor. |
|
@Caglayan06 Could you confirm you're running in with the production flag? Just want to make sure the numbers are apples to apples! |
|
@Caglayan06 - It is unlikely that this is any single thing. The reproduction that @barisnisanci provided may not match what your applications profile shows. Can you provide a reproduction of the general issue in your app (or confirm that @barisnisanci's example repo from above represents your usage scenarios / profile output)? |
|
Do you have any comments on @barisnisanci's latest post in this thread? |
|
recently we upgrade to ember 3.16.8, we have no perf test case and not find obvious performance problem just now. PS: more memory and cpu used in ie11. sometimes it causes the ie11 crash . |
@rwjblue @barisnisanci's example works same for me how @barisnisanci says.
@scottmessinger yes, we're running in with production flag. Our results similar with @barisnisanci' results. We improved our code structure. It increased performance But still it's not fast as ember 2.18 version. If we make that changes in 2.18 we took best results. We can not overhaul our code system to change 3.16 code syntax and new features. This is too costly for us, because our project is huge. Probably refactoring all project is more costly than to change framework. Will any action be taken on this problem? |
Yes, of course! We just need to find time to profile and figure out what is going on. But that doesn’t really need to wait on anyone but you digging in 😸 |
@Caglayan06 - Hmm, that’s not really what I asked. I know that @barisnisanci’s example works, I’m asking you to review it / profile it / compare the performance characteristics to your application and see if the way that the example works (and is slower) matches your application. |
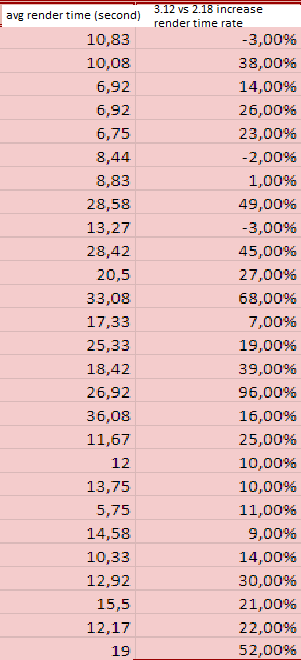
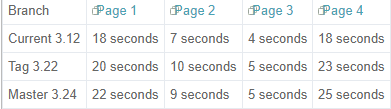
@rwjblue i integrate @barisnisanci's repo to our application, it gave similar results. When we change version from 3.16 to 3.12, our performance was boosted. In our application for some examples: As a result: |
|
3.20 has a VM upgrade, so I wonder if that would help here |
|
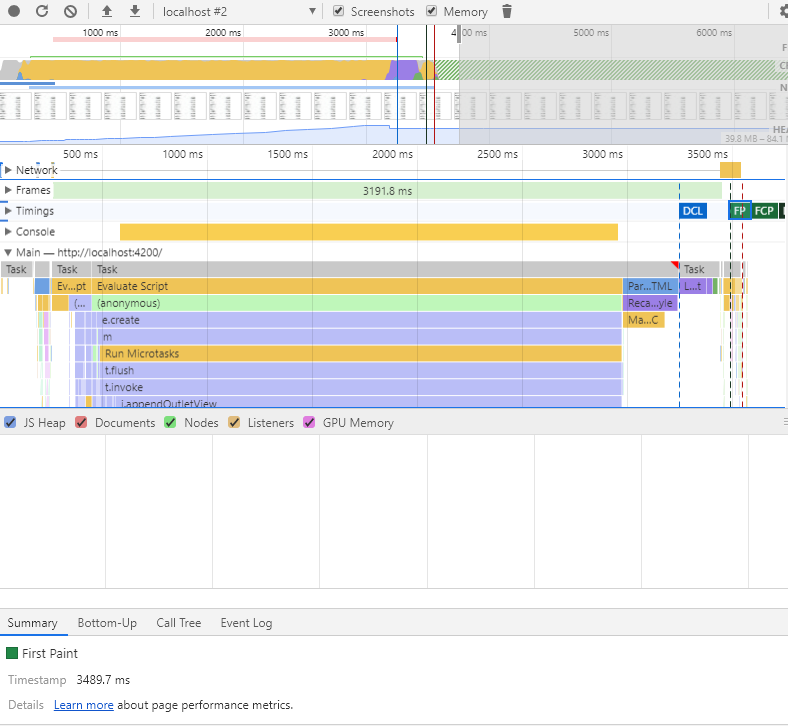
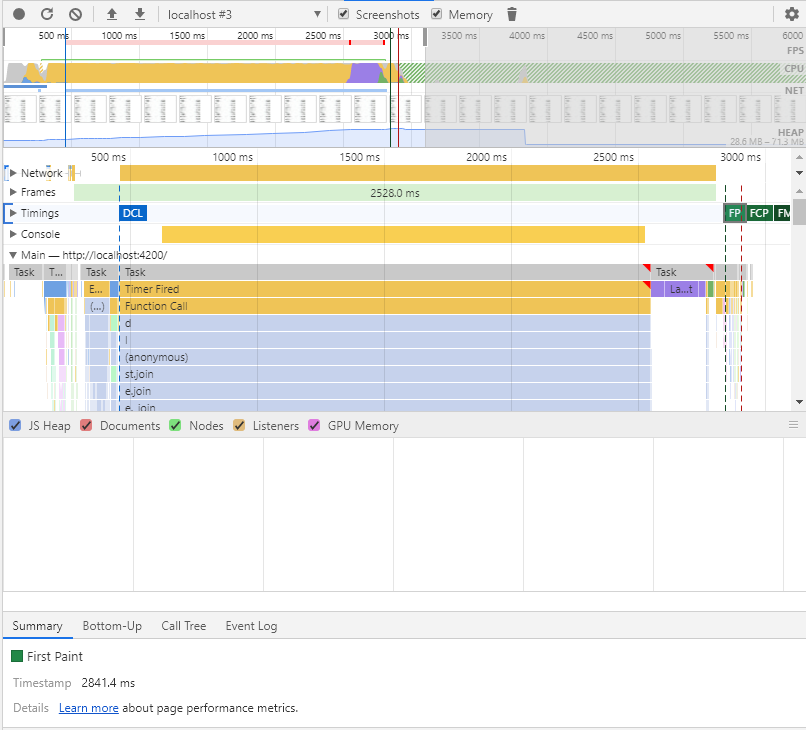
@NullVoxPopuli had no luck with 3.20.0-beta.2 FP: 3.4 seconds (same with 3.18) Since 3.12 shows better results I think the problem may be introduced with auto tracking. Also #18225 might be related considering whole application performance drop in @Caglayan06 's 3.12 -> 3.16 benchmarks. |
|
Hm. I wonder how much overhead the backwards compat stuff is |
|
A few general questions:
|
Also the example repository does not use any of above but still slower in 3.X. Render times might have gradually increased in each minor version so we cannot pinpoint the exact issue. |
|
Tracerbench reports showing that 2.18 to 3.18 does regress ~17% for this scenario but also improves instead of regresses by ~18% if a conversion to glimmer component is done. 2.18 to 3.18 No other Changes I've got my own fork of this where I've added an automated runner for this, and am working to improve the runner so that we can quickly narrow down by version/commit to find where the regression(s) occurred. https://github.com/runspired/version-performance/runs/801596557 |
|
Major thanks to @runspired for setting up those tests! Now that we have a solid setup for reliably measuring the regression, we can iterate toward fixing these issues. For context, @krisselden developed TracerBench as a tool specifically for testing performance in a wholistic way, and we have been using it for major refactors internally such as the implementation of decorators and autotracking/revision tracking. At LinkedIn we use it to test our applications before every Ember upgrade, and we haven't seen this level of regression. However, it could definitely be something we missed. In the end we are testing specific apps, which have specific use cases and behaviors. This could be an issue we didn't catch because our test case apps did not use the functionality that regressed, like @barisnisanci's reproduction. It's also possible that even if we fix the issues in that reproduction, we may not fix others, so if you're experiencing regressions we would definitely appreciate reproductions for your use case. We'll be working on making the TracerBench setup easier to use so you can test it out locally and submit a repro like @runspired's. We are going to be digging in to figure out what the exact problem is and figure out a solution. Most importantly, this level of regression is not acceptable for any API, even if we're seeing a speed up with Octane. If users can't upgrade and switch incrementally, then we aren't all climbing the mountain together. Stay tuned for more updates, we'll let you know as we figure things out! |
|
Many thanks to @runspired for his wicked cool https://github.com/TracerBench/tracerbench-compare-action |
|
Just wanted to give a quick update on this: We ran a TracerBench test similar to the one that @runspired set up with emberobserver.com, which is one of our usual test applications, to see if there was any frog boiling that had occurred (e.g. small performance changes that were insignificant from version to version, but summed up to a large shift). Here are the results of that test: We can see from these results that there are two fairly definitive jumps:
The regression in 3.17 is due to the Glimmer VM upgrade, and we're currently focusing on reducing that since it's fairly recent and will likely begin to affect applications that are updating on the LTS cycle soon. The regression in 3.1 was actually known at the time, upon discussion with the core team. It was caused, in part, by enabling native getters and using In general, the Thanks everyone for your patience! |
|
May we get an update on this issue? It's been about two months. |
|
Yes! It's been a long two months, we've been working hard on this issue and in continuing our refactors in the Glimmer VM, which dove tailed nicely with this. As I mentioned before, we were focusing on two separate sets of fixes:
For the first set of fixes, we refactored a decent amount of classic Ember code, as it was the code that was most affected. We were able to reduce the overall performance loss from 3.16-3.20 down to statistically insignificant amounts this way, based on testing in our internal applications at LinkedIn. I haven't had a chance to run the tests against Ember Observer unfortunately, but I think it would be a similar result as they usually track pretty closely together. For the second set of fixes, we relatively recently landed these as a lot of them were very large, including:
The results are pretty great! This is comparing the current master of Ember to Ember 2.18, with the above reproduction from @barisnisanci. Now, as mentioned before, this is a benchmark for a very specific use case, which is also overly simple. We did not see such a dramatic improvement in any of our real-world app benchmarks, it was much more modest overall. Hopefully this will help @barisnisanci and other's applications and we're definitely interested to hear back from them! |
|
Tested repo above with master branch of ember. Still First Paint: (3035.7 ms) seems greater than 2.18 (2752.3 ms) Also tested on our production with different ember versions. Master branch seems %25 to %40 slower than 3.12 on our app. With the results below we can't upgrade ember without major refactoring.
|
|
@barisnisanci Sorry that seems to be the case! As I mentioned before in this thread, we are going to need to reproduce these results in a statistically sound manner in order to be able to A. confirm the issue and B. iterate toward improvements and a better solution overall. I recommend either adding TracerBench to your application so you can run these benchmarks yourself, or making another reproduction which demonstrates the issue now on |
|
Does refactoring to glimmer components have any impact? We recently experienced this when upgrading from 3.11 to 3.13 and had to revert back as the decrease in performance causes our selenium tests to timeout. We are to find some way to continue forward without the need to jump many versions to when a final solution is introduced. |
|
@bbtb1982 it's hard to give exact estimates without doing a full refactor of a specific use case, but so far we've seen positive results in general from refactoring to Glimmer components. However, the best results have come from doing so with autotracking, which is only available in Ember 3.13+. One thing that we've seen users struggle with in terms of performance is observers. These were always not very performant, but have become even less so recently as they've been removed from the main programming model and generally discouraged. Refactoring to remove observers, if they're present in your app, could be a good starting point. |
|
No update on this topic since January ? We still have more an more performance issues in our apps since we moved all our components to Glimmer. The performance problem seems much worse on Chrome than on Firefox. |
|
Many performance issues are application specific, so while there are things we can do make general perf better everywhere: Like glimmerjs/glimmer-vm#1322 Ultimately, every perf issue needs careful investigation for each the app, and there are types of performance issues that just cannot be addressed by a framework, because the issues are in the app, not saying that that's what's happening in your situation, but is a possibility. to get started with debugging your specific use case:
|
|
@NullVoxPopuli what is Ember's strategy for avoiding performance regressions after each version upgrade? At the moment it seems like a guessing game. Perhaps the team can put together some benchmarks which are representative of "real world" apps? |
|
Just chiming in because we also saw a significant performance decrease and I thought this could help others. The main issue was with the initial rendering of long lists of items (~100-300) with each item rendering 10-20 components. Even though we saw a performance improvement with the latest ember releases (currently running v3.27) the performance was still significantly slower than v3.4. With all of that said I don't think this is Ember or Glimmer specific; this must be an issue that all rendering engines face. Throwing hundreds if not thousands of items to be rendered all once will block the devices main thread, cause noticeable jerk and interfere with user interactions. In our case pagination was not an option. All items must be displayed on screen. Instead we built a class decorator that defers the rendering by taking a list of items, returning a list of promises, and adjusted the rendering delay to avoid locking the main thread as much as possible : // some-list/component.js
import BaseListComponent from 'app/pods/components/base/list/component';
import { withDeferredRendering } from 'app/decorators/list/with-deferred-rendering';
import { inject as service } from '@ember/service';
@withDeferredRendering({ chunkSize: 5, chunkDelay: 50 })
export default class SomeListComponent extends BaseListComponent {
@service isMobile;
constructor() {
super(...arguments);
// slow down rendering on slower devices to prevent UI blocking
if (this.isMobile.any && !this.isMobile.apple.device) {
this.chunkSize = 2;
this.chunkDelay = 100;
}
}
}The full gist: https://gist.github.com/jdurand/cebb2e5ad16fe3bb227b53eeb065caf4 This is still a work in progress but so far we're pretty happy with the results. Glimmer handles promises very well :
Hoping this helps someone. |
there are already benchmarks as a part of CI in the Glimmer VM, available here: https://github.com/glimmerjs/glimmer-vm/blob/master/.github/workflows/perf.yml if you have any other ideas, or know of tools that would help where the That approach is really clever! nice! I'd love to see this as an addon or something, maybe as a wrapping component instead of a class decorator?
confirm -- having used a few ecosystems outside of ember, rendering a ton of stuff is just hard on browsers. Ideally, browsers would implement native occlusion culling... which would help a ton... but. 🙃 |
|
@NullVoxPopuli I like the idea of just removing the class decorator invocation to remove the deferred rendering behaviour without touching anything else... but, yeah; that was mostly me trying to find a use case for a custom class decorator 🤷🏾♂️ . Most of what's under the hood should fit right in that wrapping component blueprint. I'd be curious to measure how much overhead we're adding by rendering the skeleton, tearing it down and then rendering the actual content. I'd love to publish this as an addon, but I haven't found a solution to the main problem yet; all of these use cases force a partial rerender :
In all cases, the part of the list that hasn't moved stays as is, but everything after rerenders. Adding an item to the end of the list happens in a blip; adding an item to the beginning of the list rerenders the whole thing. The best solution I found so far is to split the list in groups that won't move (think alphabetical anchors or time separators) and have the items render synchronously within those groups. When moving an item from group 1 to group 50, only items from those 2 groups are rerendered as opposed to having the whole list rerender. There isn't a way to just "insert" a dom element with Glimmer right? |
|
Have you tried setting the key argument on each? Sounds like that might solve all the extraneous rerender issues |
|
🤯 it's kind of annoying how simple that was. |
|
I'm going to close this issue. We're far into the 3.x series, nearly at its end. There has been a lot of discussion and activity on this ticket around specific areas of work. Clearly, some amount of the issues discussed have been remedied, and some remain open. I encourage users flagging performance regressions (which we very much want to hear about) to open new tickets. Flagging specific versions of Ember which are impacted, and sharing a reproduction which runs with each version of Ember, is the fastest path to getting another contributor to dive in. |
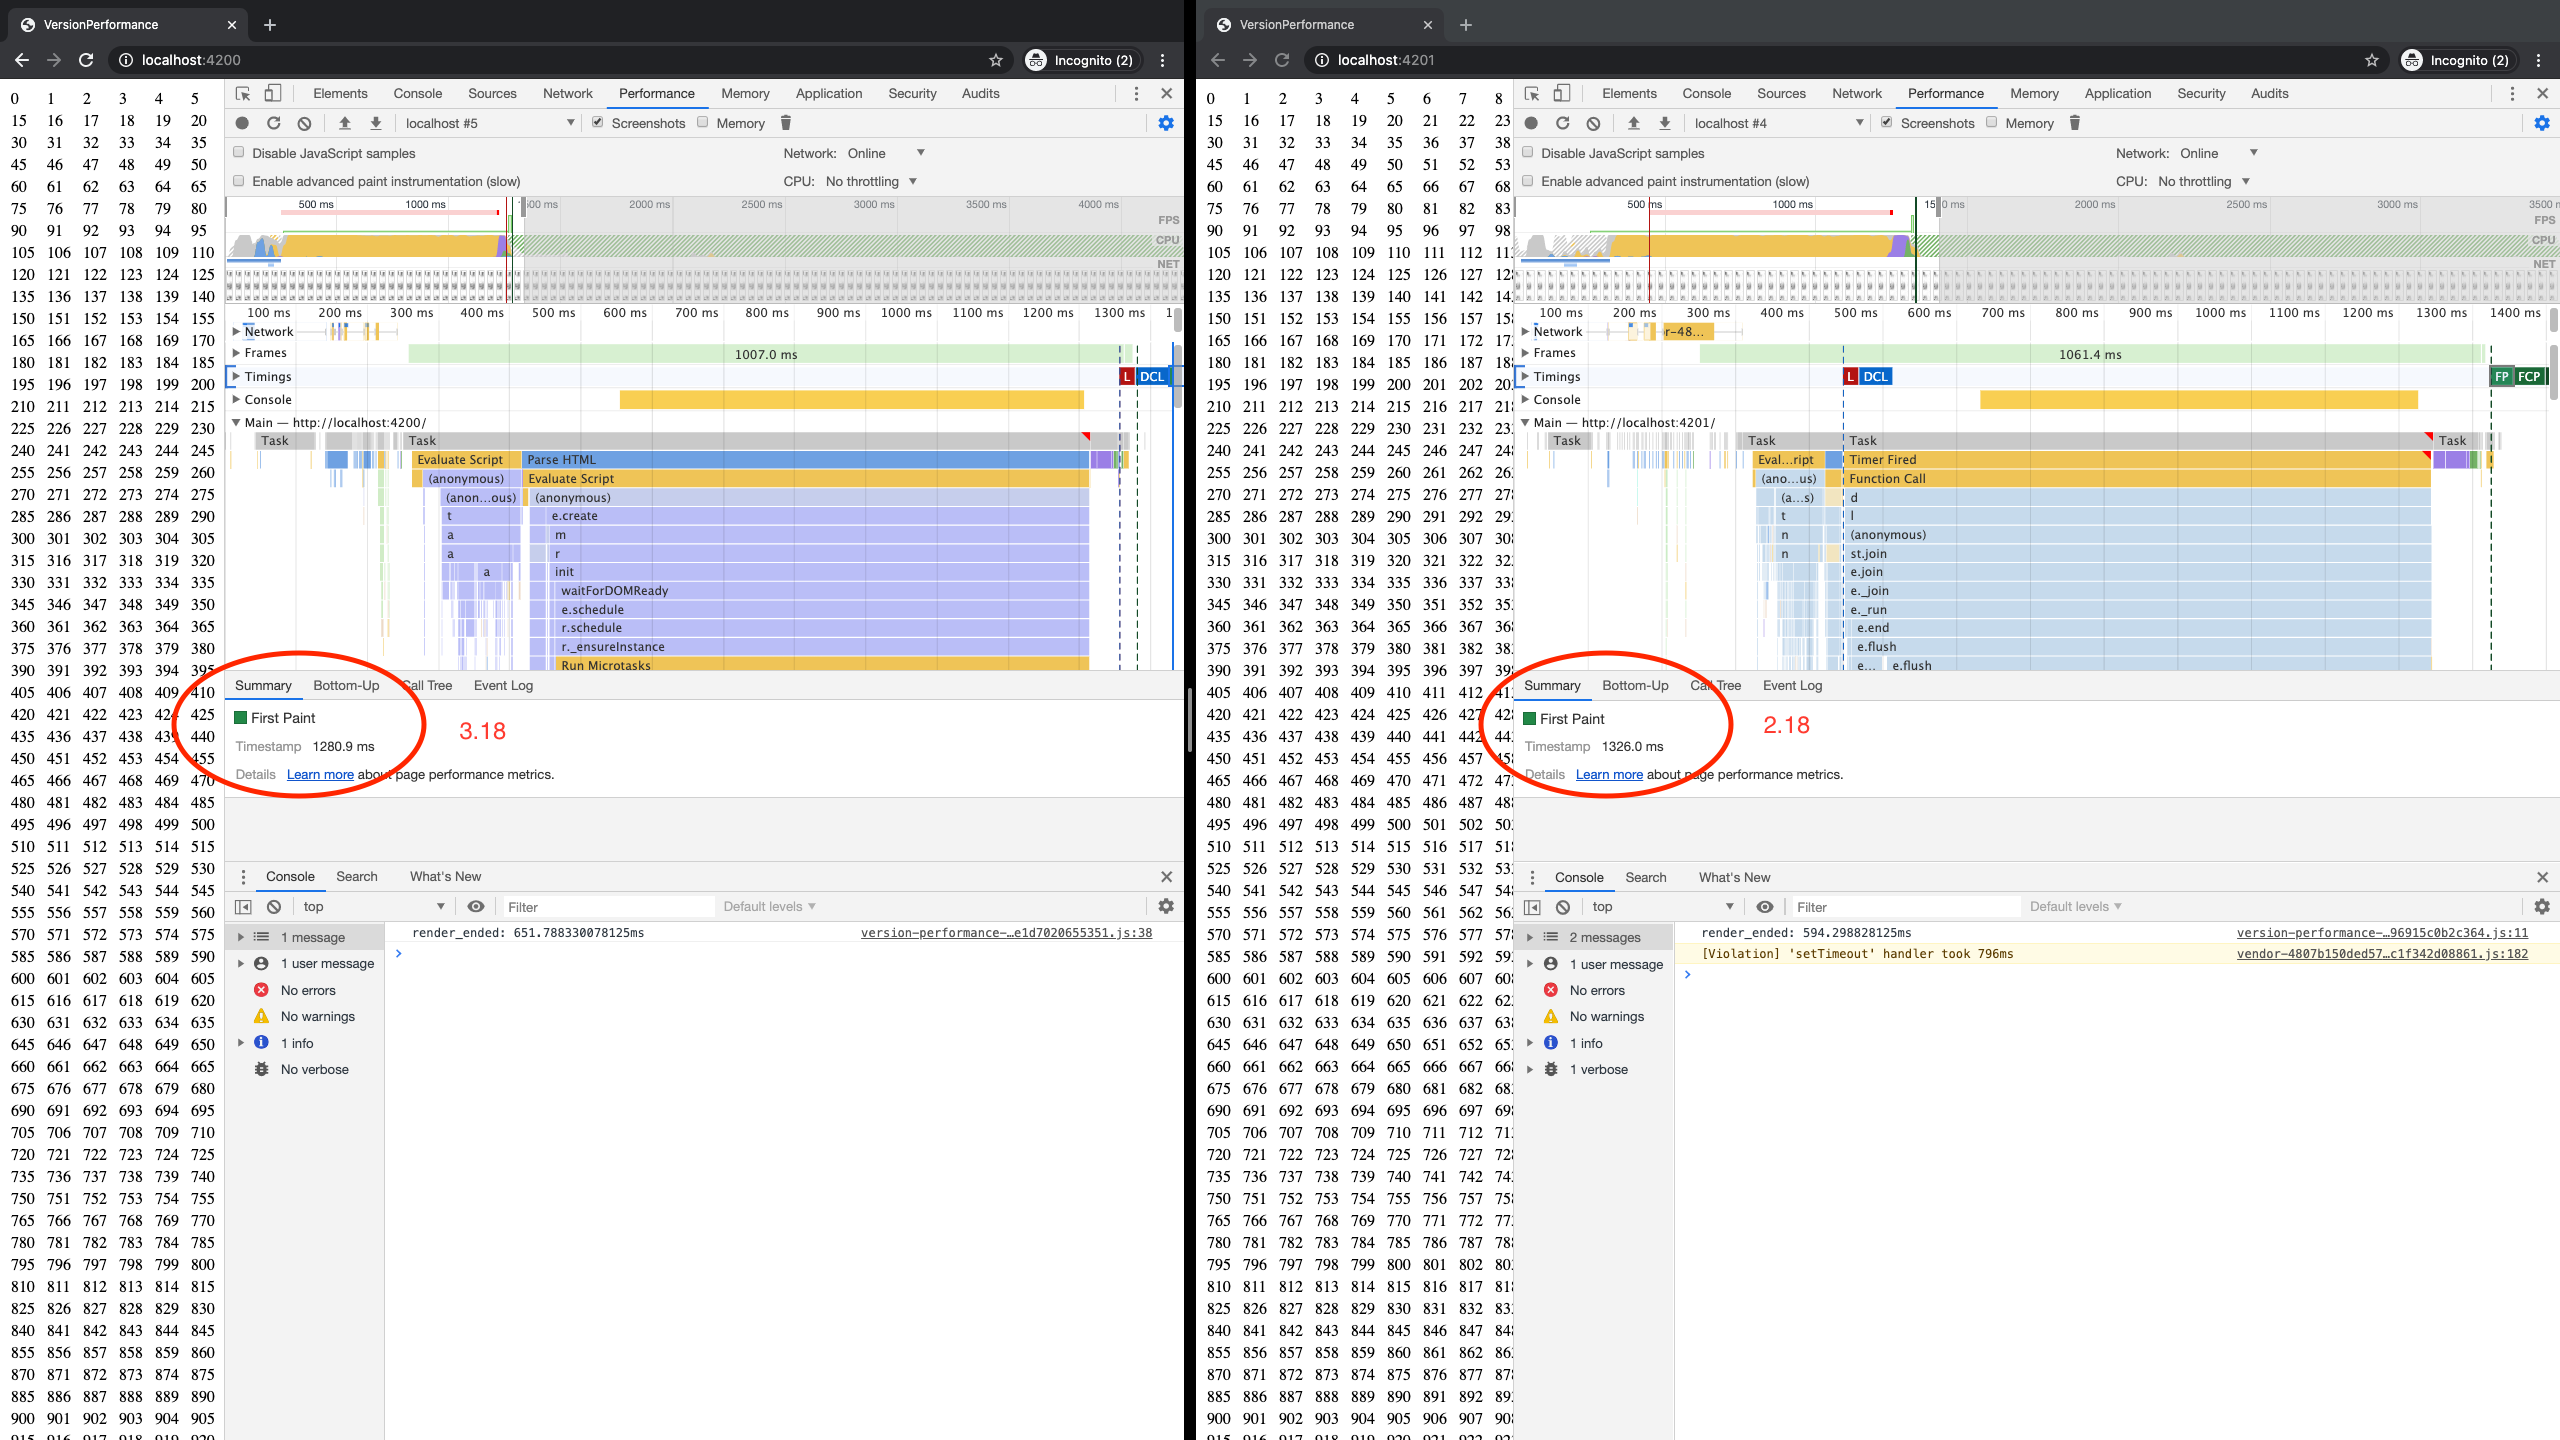
There is a 60 percent performance loss between versions 2.X and 3.X. See render time logs in below fiddles in different versions. Examples simplified to demonstrate pure render performance without any styling and computations.
2.18 fiddle render time: ~500ms
3.18 fiddle render time: ~800ms
The text was updated successfully, but these errors were encountered: