React DevTools and Redux DevTools tabs sometimes not appearing Electron@9.0.0 #23662
Comments
|
While there do seem to be timing issues, the specific issue described here is hinted in the warning.
|
|
Looks like this might be due to the extension's use of the browserAction API, which Electron doesn't support. |
|
On my machine, using the current version of React DevTools: I'm able to get the extension working by wrapping the calls to I'll look into providing stubs for those APIs so that React DevTools will load correctly. |
|
Hm, on closer inspection, I think the It seems like opening the devtools early during pageload is more likely to result in the devtools tab not appearing, while waiting a few seconds after pageload before opening devtools seems to result in the tabs appearing fairly reliably. |
+1 to that, that's the exact timing issues that I experience with react devtools extension. Closing and reopening devtools also helps. |
|
@nornagon What is also interesting here is that app.on("web-contents-created", (event, contents) => {
console.log(contents.history)
})behaves differently, and logs one more web contents instance in the scenario when react devtools tab does not appear, with |
|
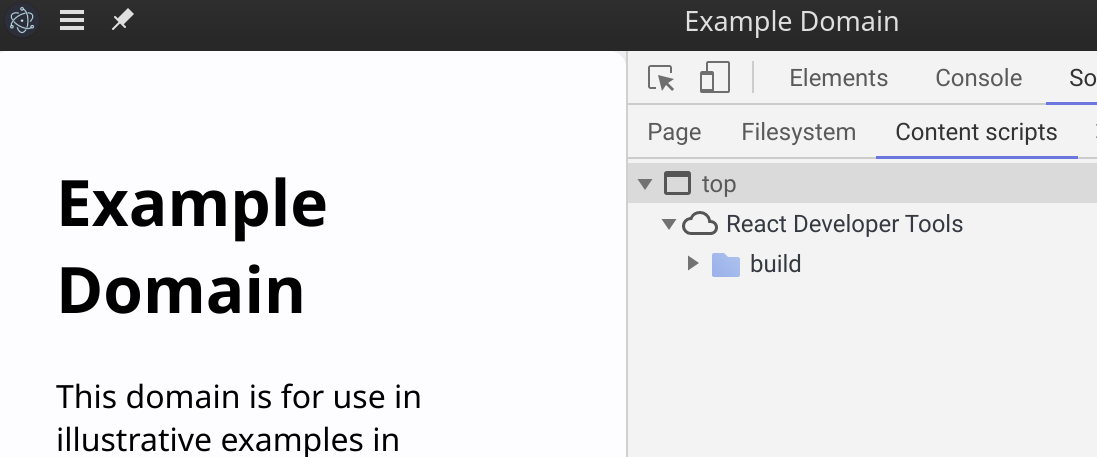
@ChALkeR here's what i observe from in a successful situation: in a failing situation: This would seem to indicate that the issue occurs when the extension's background page hasn't loaded when devtools is opened. |
|
I was able to reproduce the above behavior in Chrome.
The React Devtools tabs will be missing. Closing and reopening the devtools causes the React Devtools tab to appear. This behavior matches what I observe in Electron. |
|
@nornagon In a successful situation, I don't see the extra webcontents at all. Here is the code: const { BrowserWindow, app, ...electron } = require('electron')
const path = require('path')
console.log(`Electron: ${process.versions.electron}`)
app.on("web-contents-created", (event, contents) => {
  console.log(contents.history)
})
app.on('ready', async () => {
const window = new BrowserWindow({
webPreferences: {
webSecurity: true,
contextIsolation: true,
nodeIntegration: false,
nativeWindowOpen: true,
enableRemoteModule: false,
sandbox: true,
partition: 'persist:tmp',
}
})
const rd = path.join(__dirname, 'react-devtools')
window.webContents.session.loadExtension(rd)
window.loadURL('https://reactjs.org/')
window.openDevTools({mode:'detach'})
window.show()
})Adding a delay Perhaps that's a separate bug with |
|
Here's my repro code: const { app, session, BrowserWindow } = require('electron');
const path = require('path');
(async () => {
await app.whenReady()
await session.defaultSession.loadExtension(path.join(__dirname, 'react-devtools-extension'))
const bw = new BrowserWindow({webPreferences: {sandbox: true}})
bw.loadURL('https://reactjs.org')
})()
app.on("web-contents-created", (event, contents) => {
console.log(contents.history)
}) |
|
@nornagon modifying your code and adding one line: const { app, session, BrowserWindow } = require('electron');
const path = require('path');
(async () => {
await app.whenReady()
await session.defaultSession.loadExtension(path.join(__dirname, 'react-devtools-extension'))
const bw = new BrowserWindow({webPreferences: {sandbox: true}})
bw.loadURL('https://reactjs.org')
bw.openDevTools() // this line was added, note no delay
})()
app.on("web-contents-created", (event, contents) => {
console.log(contents.history)
})I observe that:
upd: fixed order Does this have to do something with the extension, or is this likely to be a bug in Upd: seems related to extension loading somehow, and not to the event. This code also produces different output in those scenarios (2 vs 3 webContents), 2 when react devtools works, 3 when not. setTimeout(() => {
const all = webContents.getAllWebContents()
console.log(Date.now(), all.length, all.map(x => x.history))
}, 5000) |
|
Same problem with Vue devtools. |
Those extensions worked with electron@8.2.0 and we didn't observe any errors and warning at startup time with version 8.2.0 ) |
|
The implementation of extensions in Electron changed drastically with 9.x: #21814 |
|
@ChALkeR I have observed some situations in which the WebContents are created in this order:
and the devtools tabs do appear and function correctly. So I suspect there's also an element of timing from the loaded web page sending a message to the extension. Given that this is reproducible in Chrome, I've filed a bug upstream: https://bugs.chromium.org/p/chromium/issues/detail?id=1085215 |
|
NB. to folks finding this issue, the warnings about "unrecognized manifest key", "permission malformed" and the _metadata directory are just that: warnings. They are not the cause of this issue. |
For me react-dev-tools was working properly also on 8.3.0 and stopped loading on 9.0.0 |
|
@idanwork a workaround for now is to close and re-open devtools. |
|
Re: webContents -- it still confuses me why a situation where everything works can have either 2 or 3 webContents instances. Something doesn't seem right, even if that's not directly related to this issue. Re:
It looks to me that there might be some other problems. |
|
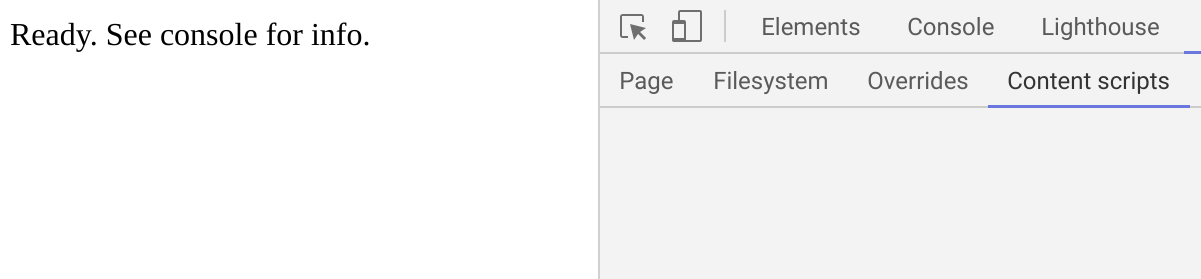
@nornagon I confirmed that extensions don't work with E.g., using the code from #23662 (comment), on https://example.com (which doesn't have React) there is no "React" tab (as expected), but a content script is there: On react-devtools has this in "permissions": [ "file:///*", "http://*/*", "https://*/*" ],Chrome behaves the same, but it has an Any hint how to do that in Electron? This seems to be the main problem here and is not timing-related. |
|
Same with VueJS Devtools. Electron version: 9.0.0 |
|
See also facebook/react#19002 |
|
@nornagon Even without react-devtools, with Should I open a new issue for that to unclutter this one? As this apparently is a combination of problems, not a single problem. |
|
@ChALkeR supporting extensions on file:// urls is a separate thing, yes. Would be great to open a new issue for that. |
|
any ideas how to fix this? |
|
Watch the PR. |
|
electron version: 11.3.0 session.defaultSession.loadExtension(
'/Users/xxx/Library/Application Support/Google/Chrome/Default/Extensions/fmkadmapgofadopljbjfkapdkoienihi/4.10.1_7',
{ allowFileAccess: true }
)still have this problem |
|
@jackple @jorgercg @nornagon Electron 11.3.0, can show the devtool but cannot work. Keep showing these: |
|
Electron 11.3.0 same error but it's work |
|
If you have this problem app.whenReady().then(async () => {
await session.defaultSession.loadExtension(
reactDevToolsPath,
{ allowFileAccess: true } //this is the key line
)
}).then(createWindow).catch(console.log); |
|
Testing on Electron 11.3.0 on Win 10 x64 When building the Ng app just w/ Ng serve to see that NgRx store works in general, the store works in brower. Running Electron 11.3.0 with the NgRx store does not work in Chrome 87.0.4280.141 browser, same error message Console logs these errors: how is this working for you guys ? Anybody here on Win 10 ? |
|
No joy for me. 😞 |
|
@dperetti everything works for me on OSX for Ember Inspector. How are you loading the extension? |
|
DevTools tabs work for me even without the |
|
Same Problem as @radoslavk |
|
Those warnings are ignorable, Electron does not support the features to which those manifest keys relate. |
|
"Ignorable warnings" are, in mind a bug since users will be inexorably trained to ignore warnings. |
|
I finally was able to get Redux DevTools working on Electron 12.0.2 by loading the extension directly - using the Win 10x64 |
Summary:
When trying to run some React component performance profiles, the updates registered made absolutely no sense (components rerendering without any parent or other cause causing them to render etc). That turned out to be caused by having an outdated version of the React devTools in Flipper.

Sadly the newer version of the React DevTools didn't work with our current Electron version anymore. Some horrible hacking is needed to work around that.

To help with updating the tools in the future (they are by default cached forever on the local machine), I've introduced the `FLIPPER_UPDATE_DEV_TOOLS` variable.

The plugin loading work around is inspired by electron/electron#23662 (comment)

Reviewed By: passy

Differential Revision: D27685981

fbshipit-source-id: c35e49aff9b2457b63122eeee0d5c042ddd3b08b
|
This is still happening on electron 11.0.1... |
|
There are 3 devtools-related issues that I've run into simultanously:
Assuming your issue is the race condition and not the other 2, delaying win.webContents.once('did-finish-load', () => {
setTimeout(() => {
if (win && !win.isDestroyed()) {
win.webContents.openDevTools();
}
}, 5000);
}); |
Per electron/electron#23662 and electron/electron#25198 this is necessary to allow access to extensions via file://

Closes MarshallOfSound#161
Closes MarshallOfSound#162
|
Still not able to load react devtools with electron 10.1.1... |
|
Make sure you use example: |
|
my code in main.ts: Initially I get this output:
then, when I open the developer tools, I get
and in the developer tools console, I get:
from renderer.bundle.js:205648 |
This resolved it for me.
app.whenReady().then(async () => {
  await session.defaultSession.loadExtension(vueDevToolsPath, { allowFileAccess: true })
  createWindow()
  app.on('activate', function () {
    if (BrowserWindow.getAllWindows().length === 0) createWindow()
  })
}) |
Preflight Checklist
Issue Details
Expected Behavior
In our project we are loading ReactDevTool and ReduxDevTools.
In the terminal for version 9.0.0 we see warnings:
And both extensions don't work.
Actual Behavior
No warnings in the terminal and working extensions.
The text was updated successfully, but these errors were encountered: