[UI] Charts Enhancements: Themes, DPI, legend hiding #4288
Comments
|
Do we really need the sitemap configuration? I might be better when every client choose the theme itself. |
|
Good point. I thought of that too and came to this conclusion: If the user absolutely wants a specific theme, he/she can define it in the sitemap with The "client", like the OpenHAB android app, would check if there is a theme defined for this chart. I absolutely had the andoid app in mind while working on this change, because every night when I turn on my smartphone to check my room temperatures in the app, my retina gets burned with the bright white charts ;) Other opinions? Edit: Removed |
Than he should change the theme of his client or open an issue if that is not available.
There should be enough themes, e.g. blue bright, blue dark, red bright, red dark, ... |
|
Ok, I will rethink this. Maybe it's better to work only on the ChartServlet/DefaultChartProvider within this issue and keep the other sitemap stuff seperate, if at all. What do you think about a "fontscale" parameter for the ChartServlet?
Lets assume the "fontscale" parameter gives the scaling in percent.
|
|
Sounds good |
|
Regarding you suggestion for a new parameter "hide-legend" from openhab/openhab-android#373
But this parameter is a candidate for the sitemap chart element, isn't it? |
|
It might be good for a workaround for openhab/openhab-core#80, e.g. click on the chart to toggle legend. |
|
Other use case: each of my temperature sensors (bedroom, living room, ...) has it's own chart. They are in own frames with a headline and the concrete temperature item. So I know what the chart shows and I don't want a seperate legend that hides information. |
|
Ok so this is an example with the following parameters:
And the default:
|


|
You should adjust the graph colors in the dark theme. Blue is not very good readable |
|
Another option: remove-grid |
|
Yep, colors are not finished yet. I should ask some persons that have more taste than me to review the colors ;) |
|
Consider taking the "500" colors: https://material.io/guidelines/style/color.html |
|
Another idea: transparent background as seperate option. |
|
Thanks for your suggestion regarding colors, will try these. |
|
Default (current) colors: Example with "500" colors from material.io with black theme on the openHAB android app: New dark chart theme on the openHAB android app: |


…rchived#4288

Signed-off-by: Holger Reichert <mail@h0lger.de>
|
Thanks for the good discussion - I specifically like the look of the dark theme for the Android app, this is indeed a huge improvement. A few thoughts from my side: For all ideas that are discussed, we have to keep in mind that they should be applicable to ANY chart provider; currently, we really only have one, but there might be others in future, which come with completely different styles and features.
So it is indeed time to use it. It was @cdjackson who created that interface, so it might be a good idea to involve him in the discussion. The JavaDocs states: "The provider should store its own themes.". This seems to suggest that themes should be defined individually for a chart provider (within its own configuration). If we'd follow this approach, we would not have a
I would prefer to find a way to leave it to the chart provider to decide what is the most appropriate font size for the rendered image. The main issue currently is that the font size is chosen wrt the resolution of the image. With ever increasing dpis of our screens, this led to too small fonts now. So maybe a dpi setting might be a better choice than font-size? The chart provider could use this information to also optimize other parts like the line width, the grid, etc.
How about "legend=true/false" (i.e. requiring to specifically name it instead of using its presence to decide for the value)? We might actually want to use "true" as a default if the chart contains multiple lines and "false", if there is anyhow just a single value - this should probably address 95% of all cases without requiring the user to define that value. |
|
Thanks @kaikreuzer for your suggestions, very appreciated.
Right, that's why I defined the interface in the package
Excellent. I was so locked in my "change the font SIZE" thoughts, that I completely ignored the existence of dpi.
For the ChartServlet it is/was hidelegend=true/false. Will change it to legend=true/false probably. But for the sitemap (parameterless attribute
👍 |
|
@hreichert So you have the implementation for the Android App? Can you show me the code? |
|
@mueller-ma No, I have done nothing in the app yet. For testing and screenshots I just temporarily modified the |
|
Thanks again @kaikreuzer for your DPI hint. 300x200 96dpi: 3000x2000 450dpi: 6000x3000 680dpi: 1920x1080 320 dpi (one of my smartphones): |
No, afaik not yet. But the issue with doing it similar to
Looks pretty nice! |
|
Indeed. Rework ongoing. |
…chived#4288

Signed-off-by: Holger Reichert <mail@h0lger.de>
…chived#4288

Signed-off-by: Holger Reichert <mail@h0lger.de>
…chived#4288

Signed-off-by: Holger Reichert <mail@h0lger.de>
…#4288

Signed-off-by: Holger Reichert <mail@h0lger.de>
|
Done. Updated PR: #4291 |
|
As the PR for this functionality is merged, I close this issue. |
|
@hreichert You create a white theme with complete white background? |
|
@mueller-ma Is the "bright" theme not sufficient? |
|
IMO it looks kind of outdated with the grey |
|
What about this one? Compared to "bright": I'm not happy with the yellow on both... |


|
Looks good |
|
You could remove it, 8 colors should be enough. |
|
Replaced yellow with "lime" on the new |
I would like to add some enhancements to the ChartServlet, DefaultChartProvider, REST API, BasicUI/ClassicUI to support the following things:
dpiparameter for dynamic sizes based on DPIlegendparameter to hide/show the chart legendTheme support
Chart Servlet
My change extends the ChartServlet with a new GET parameter
theme, like this:/chart?groups=gChart&theme=darkThe
themeparameter is optional.New interface
ChartThemefor theDefaultChartProviderA new interface that themes for the
DefaultChartProvidercan implement.As the javadoc for
ChartProvidersuggests, this is only used for this concrete chart provider and so the interface is in theorg.eclipse.smarthome.ui.internal.chart.defaultchartproviderpackage.New themes:
The themes can also calculate values (font sizes, line widths) based on the DPI value. See below.
Compatibility
This behaviour introduces no changes to existing users of charts:
themeparameter is optional at all placesDPI support
Regarding to #4284 it would be a great improvement to have dynamic font sizes.
Because different font sizes are used in the same chart, a single "fontsize=10px" parameter would not be sufficient, especially if we take different screen resolutions / DPI into account.
A new
dpiparameter is now used to calculate font sizes, the width of the chart series lines and the grid lines.ChartServlet
My change extends the
ChartServletwith a new GET parameterdpi, like this:/chart?groups=gChart&dpi=320The
dpiparameter is optional. Default is 96.Compatibility
This behaviour introduces no changes to existing users of charts:
dpiparameter is optional at all placesLegend hiding
Two changes:
legend=true/falseparameter for the ChartServlet and the Sitemap model to force hiding or showing the legendChartServlet
New GET parameter
legend./chart?items=Temperature_Livingroom&legend=trueThe
legendparameter is optional. No default -> automagic, see aboveSitemap model
New optional attribute
legendfor the chart sitemap model.One can define a chart like this:
Chart item=gChart period=h legend=falseChart item=Temperature_Livingroom period=h legend=trueBasicUI / ClassicUI
The BasicUI / ClassicUI takes the optional
legendattribute from the sitemap model into account and constructs a matching url to the ChartServlet. If the parameter is not given, it's not sent to the Servlet, so the above mentioned automagic is used.REST API
The REST API delivers the
legendattribute in the chart sitemap model, if it is set.Compatibility
This behaviour introduces a change to existing users of charts:
legendparameter is optional at all places - so no issue hereRenderings
Default theme "bright", default settings:

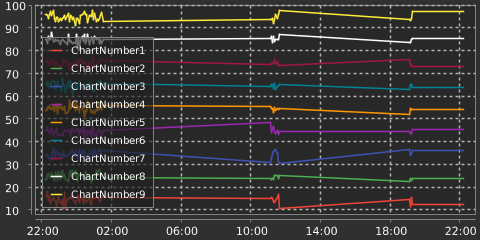
Theme "dark", default settings:
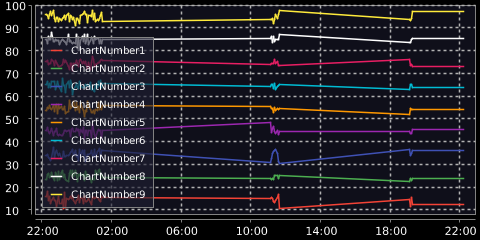
Theme "black", default settings:
Thinking further
These features can be used to improve the experience with the OpenHAB android app:
dpiparameter -> better readable charts on hi-res smartphonesMaybe also the new BasicUI theme mechanism (#4137) can use the
themeparameter to select a matching chart theme for the WebUI theme.The text was updated successfully, but these errors were encountered: