Copyright (©) 3M Company, 2018,
License: GPL version 2
Radie is a python package for experimental data primarily using pandas for data structures
The point of radie is to remove the pain of loading and visualizing experimental data. It is not meant for complex plotting or pretty pictures, but rather a focus on rapidly converging experimental data stored in files into a single place for rapid visualization.
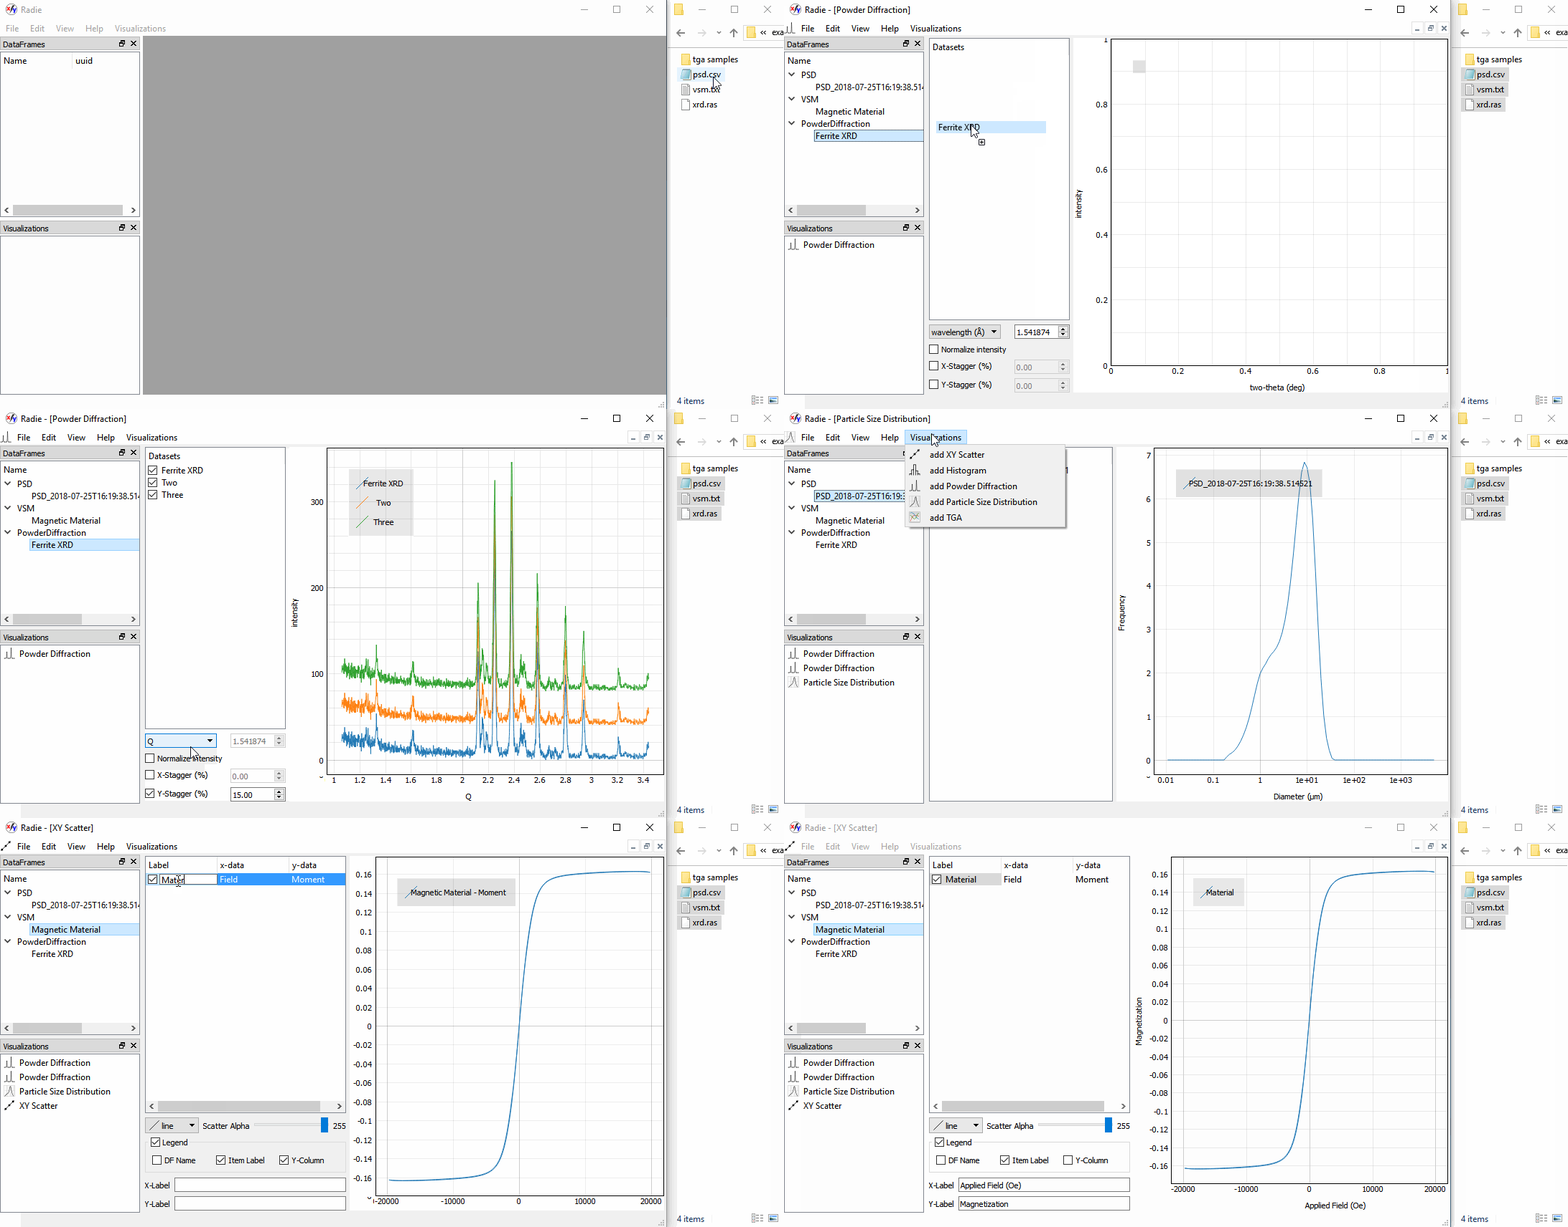
The screen capture above shows the loading of three different experimental files (Rigaku XRD file, Particle Size Distribution and an IDEA VSM file) simultaneously into the program with drag and drop using the OS file explorer. From there we initialize new visualizations and then drag the datasets into the visualizations. Each visualization is tailored to a certain goal, be it the particularities of vieweing XRD files, PSD files, or the generic needs of plotting columnar data in an XY-scatter plot. The whole process only takes a few seconds and allows the user to rapidly view and display any kind of experimental data, provided an appropriate loader plugin has been written.
import radie as rd
df = rd.DataStructure(data=[1, 2, 3], name="data frame")
print(df.metadata["name"])
print(df.metadata["date"])

csv_df = rd.load_file("my_random_data.csv")  # unspecified csv data

pow_df = rd.load_file("powder_diffraction_measurement.ras")  # powder diffraction data
print(pow_df.metadata["name"])

vsm_df = rd.load_file("magnetization_v_field.txt")  # VSM measurement
print(vsm_df.metadata["name"])

vsm_df.savetxt('my_vsm_file.df', overwrite=True)  # save as a csv with metadata
                                                  # in a commented json block
vsm_reread = rd.load_file('my_vsm_file.df')  # will read in savetxt output with
# proper class and metadata info python -m radie.qt.viewer- numpy
- pandas
additionally for the gui application:
- pyqt >= 5.6
- pyqtgraph >= 0.10
optional
- pywin32 (Windows only)
pip install radie
to use the PyQt Gui you must also have PyQt5 and pyqtgraph installed:
pip install radie PyQt5 pyqtgraph
for the latest updates, clone this repo and add radie/ to your PythonPath
On Windows, running the install_windows_shortcut.py script will install
shorcuts for radie using the same python executables that are used to
run the install script. This requires pywin32.
- Core Features:
- StructuredDataFrame - base class, just a pandas DataFrame with some restrictions, metadata and templates for more specific sub-classes
- Common text file format - This is just a csv file where the metadata attached to the .metadata property is converted to a json object and stored in a commented block at the top.
- CSV importer that under some structure assumptions attempts to:
- automatically determine delimiter
- automatically find the csv data-block
- automatically determine headers
- ignore preceding metadata
- Qt-based Gui Viewer with Drag and Drop handling of files and data-set comparison
- Extensible because (nearly) everything is a plugin
- StructuredDataFrame subclasses specify structured data (add-your-own!)
- Custom Visualizations of Structured Data, based on whatever fits into QMdiSubwindow (I use PyQtGraph)
- File-loaders written for each supported file-type, register into the system so that radie.load_file can automatically detect and load registered file-types
- **GUI save files keep all your rapid analysis in one place each plugin specifies its own save data in json format and all DataStructures have a common save format
** Planned, but not yet implemented
- Powder Diffraction:
- Rigaku (.asc, .ras)
- Bruker (.raw (v2))
- GSAS (.raw, .gsas, .fxye)
- Vibrating Sample Magnetometer:
- Lakeshore (.dat, .txt (Field v Moment))
- Particle Size Distribution:
- Horiba LA-960 (.csv)
- Thermogravimetric Analysis
- TA Instruments Q500 (.001, .002, .003)
- Differential Scanning Calorimetry (DSC)
- TA Instruments Q2000 (.001, .002, .003)
Radie is not a replacement for Origin, Igor, QtiPlot or similar gui scientific plotting/analysis packages. Instead Radie has the following goals:
- import data files, with drag and drop and automatic file-type
detection
- powder diffraction data
- spectrum data
- any data that maps to a Pandas StructuredDataFrame
- rapid comparison of datasets into automatically generated
visualizations with drag and drop
- I don't want to plot things, I want to visualize them, the software should plot for me
- reasonable interoperability with python for more complex operations
- matplotlib, bokeh, whatever, I want to do the quick visualizations and comparisons in a gui, and I will do all of the complicated analysis and crazy figure plotting in something more flexible like a Jupyter Notebook
- strong clipboard integration
- common file-saving scheme for all types of data
- saving my collected datasets and visualizations
- Origin/QtiPlot software is not my cup of tea for actually analyzing data but its nice to save your collection of data and plots in a single spot
- Jupyter Notebooks / Matplotlib are much nicer when it comes to analyzing data but all of that flexibility can screw things up in the future, it would be nice to have it all in one re-producible place that I can come back to at any time with a double click of the mouse
- reasonable exporting to excel
- Excel is the most wide-spread format for sharing/visualizing 1-D datasets and these datasets are literally everywhere. A quick button to make an excel file to share with the non-programmers out there is critical (currently Windows only)
