Skip to content
New issue

Have a question about this project? Sign up for a free GitHub account to open an issue and contact its maintainers and the community.

By clicking “Sign up for GitHub”, you agree to our terms of service and privacy statement. We’ll occasionally send you account related emails.

Already on GitHub? Sign in to your account

[HELP] duckplyr Benchmarking Comparison #61

Open
JavOrraca opened this issue Oct 14, 2023 · 6 comments
Open

[HELP] duckplyr Benchmarking Comparison #61

JavOrraca opened this issue Oct 14, 2023 · 6 comments

Comments

@JavOrraca
Copy link

I was at Posit Conf when I learned about duckplyr and this package is awesome! I'm looking forward to developing with it and thanks to the DuckDB Labs team for spearheading this initiative.

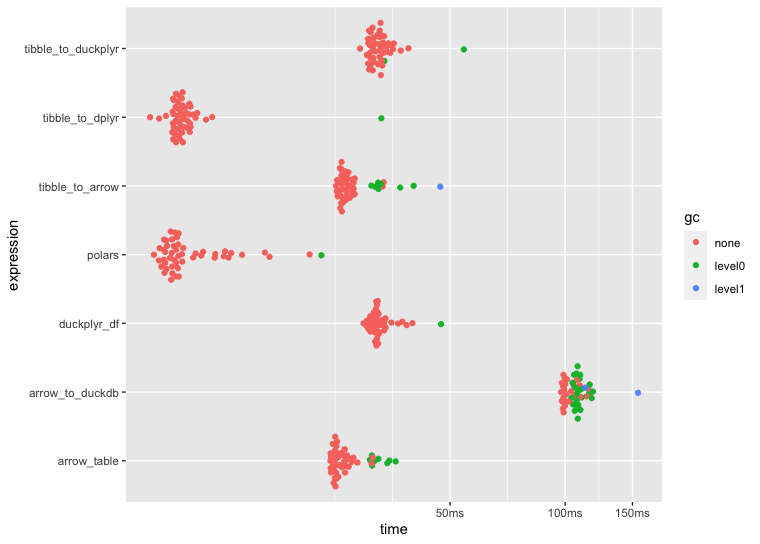
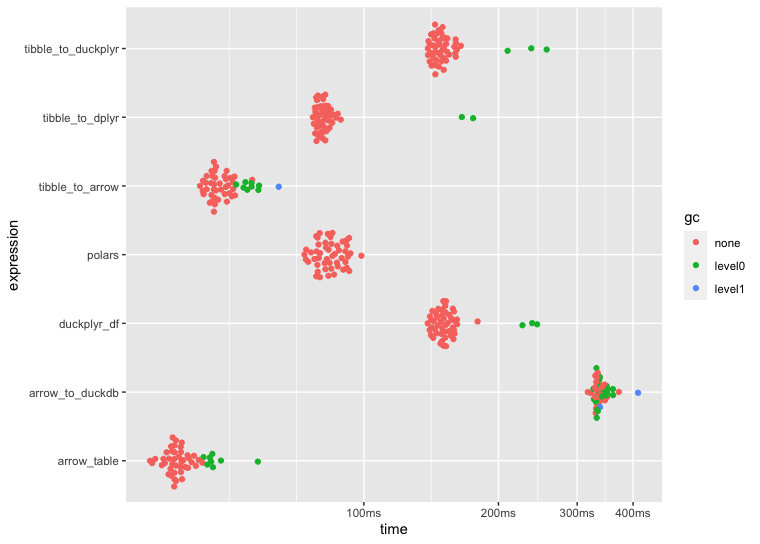
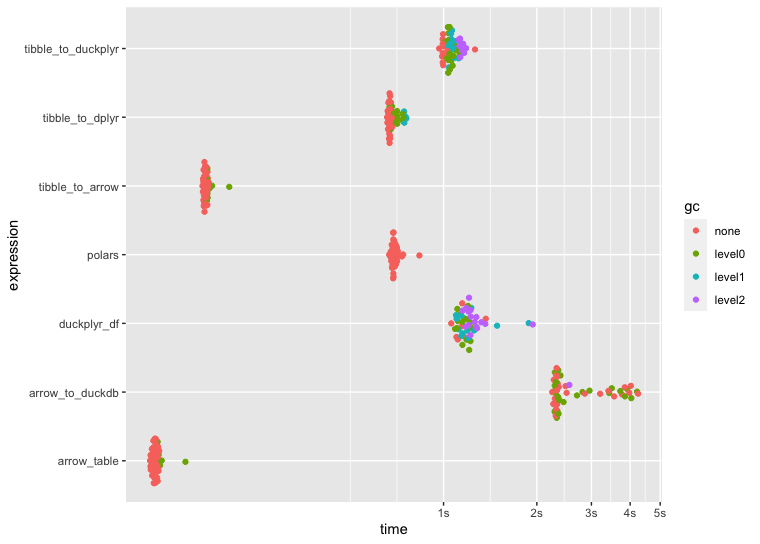
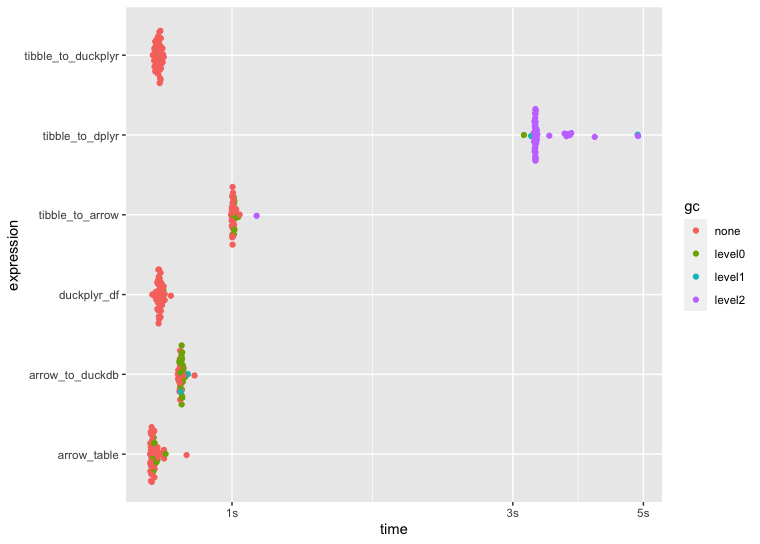
I ran some benchmarks to compare speed across a few ETL approaches using dplyr, arrow, duckdb, arrow::to_duckdb(), and duckplyr. I assume the reason for the slower ETL speeds using duckplyr boils down to user error 🙋‍♂️ but having said that, I'd appreciate any insight if my duckplyr setup and/or application is flawed in some way.

Any pointers would help, thank you! Below is the code that I used to benchmark performance including the plots generated by autoplot(bnch):


# Load Libraries ----------------------------------------------------------

require(here)
library(arrow)
library(dplyr)
library(stringr)
library(tictoc)
library(duckplyr)
library(ggplot2)


# Download Data -----------------------------------------------------------

# Download 40GB (1.1 billion rows) of NYC Taxi rides
# NOTE: This may take several hours
data_path <- here::here("data/nyc-taxi")

open_dataset("s3://voltrondata-labs-datasets/nyc-taxi") |>
  filter(year %in% 2012:2021) |> 
  write_dataset(data_path, partitioning = c("year", "month"))


# Subset & Benchmark ------------------------------------------------------

# Manually iterated over the code below to benchmark
# and compare performance on 1 million, 10 million, 100
# million, and 500 million rows
nyc_taxi_tibble <- open_dataset("data/nyc-taxi") |> 
  dplyr::select(year, passenger_count) |>
  dplyr::collect() |> 
  dplyr::slice_sample(n = 500000000)

nyc_taxi <- nyc_taxi_tibble |>
  arrow::as_arrow_table()

nyc_taxi_duckplyr_df <- nyc_taxi_tibble |> 
  duckplyr::as_duckplyr_df()

tic()
bnch <- bench::mark(
  min_iterations = 50,
  tibble_to_arrow = nyc_taxi_tibble |> 
    arrow::as_arrow_table() |> 
    dplyr::filter(passenger_count > 1) |> 
    dplyr::group_by(year) |> 
    dplyr::summarise(
      all_trips = n(),
      shared_trips = sum(passenger_count, na.rm = T)
    ) |>
    dplyr::mutate(pct_shared = shared_trips / all_trips * 100) |> 
    dplyr::collect(),
  tibble_to_duckplyr = nyc_taxi_tibble |> 
    duckplyr::as_duckplyr_df() |> 
    duckplyr::filter(passenger_count > 1) |> 
    duckplyr::summarise(
      all_trips = n(),
      shared_trips = sum(passenger_count, na.rm = T),
      .by = year
      ) |>
    duckplyr::mutate(pct_shared = shared_trips / all_trips * 100),
  tibble_to_dplyr = nyc_taxi_tibble |> 
    dplyr::filter(passenger_count > 1) |> 
    dplyr::group_by(year) |> 
    dplyr::summarise(all_trips = n(),
                     shared_trips = sum(passenger_count, na.rm = T)) |>
    dplyr::mutate(pct_shared = shared_trips / all_trips * 100),
  arrow_table = nyc_taxi |> 
    dplyr::filter(passenger_count > 1) |> 
    dplyr::group_by(year) |> 
    dplyr::summarise(
      all_trips = n(),
      shared_trips = sum(passenger_count, na.rm = T)
    ) |>
    dplyr::mutate(pct_shared = shared_trips / all_trips * 100) |> 
    dplyr::collect(),
  arrow_to_duckdb = nyc_taxi |> 
    arrow::to_duckdb() |> 
    dplyr::filter(passenger_count > 1) |> 
    dplyr::group_by(year) |> 
    dplyr::summarise(
      all_trips = n(),
      shared_trips = sum(passenger_count, na.rm = T)
    ) |>
    dplyr::mutate(pct_shared = shared_trips / all_trips * 100) |> 
    dplyr::collect(),
  duckplyr_df = nyc_taxi_duckplyr_df |> 
    duckplyr::filter(passenger_count > 1) |> 
    duckplyr::summarise(
      all_trips = n(),
      shared_trips = sum(passenger_count, na.rm = T),
      .by = year
    ) |>
    duckplyr::mutate(pct_shared = shared_trips / all_trips * 100),
  check = FALSE
)
toc()

autoplot(bnch)

# Session Info ------------------------------------------------------------

sessionInfo()

R version 4.3.1 Patched (2023-08-09 r84925)
Platform: aarch64-apple-darwin20 (64-bit)
Running under: macOS Sonoma 14.0

Matrix products: default
BLAS:   /System/Library/Frameworks/Accelerate.framework/Versions/A/Frameworks/vecLib.framework/Versions/A/libBLAS.dylib 
LAPACK: /Library/Frameworks/R.framework/Versions/4.3-arm64/Resources/lib/libRlapack.dylib;  LAPACK version 3.11.0

locale:
[1] en_US.UTF-8/en_US.UTF-8/en_US.UTF-8/C/en_US.UTF-8/en_US.UTF-8

time zone: America/Los_Angeles
tzcode source: internal

attached base packages:
[1] stats     graphics  grDevices utils     datasets  methods   base     

other attached packages:
[1] ggplot2_3.4.3  duckplyr_0.2.1 tictoc_1.2     stringr_1.5.0  dplyr_1.1.3    arrow_13.0.0  

loaded via a namespace (and not attached):
 [1] bit_4.0.5         gtable_0.3.4      compiler_4.3.1    tidyselect_1.2.0  assertthat_0.2.1 
 [6] scales_1.2.1      here_1.0.1        R6_2.5.1          generics_0.1.3    tibble_3.2.1     
[11] munsell_0.5.0     rprojroot_2.0.3   DBI_1.1.3         pillar_1.9.0      rlang_1.1.1      
[16] utf8_1.2.3        stringi_1.7.12    bit64_4.0.5       cli_3.6.1         withr_2.5.0      
[21] magrittr_2.0.3    grid_4.3.1        rstudioapi_0.15.0 lifecycle_1.0.3   vctrs_0.6.3      
[26] bench_1.1.3       glue_1.6.2        duckdb_0.8.1-3    collections_0.3.7 fansi_1.0.4      
[31] colorspace_2.1-0  purrr_1.0.2       tools_4.3.1       pkgconfig_2.0.3  

1 million rows

10 million rows

100 million rows

500 million rows

@krlmlr
Copy link
Collaborator

krlmlr commented Oct 15, 2023

Thanks for the benchmark!

This looks like a case where we don't support particular semantics but fall back to R instead. What happens if you change the code to sum() without na.rm = TRUE ?

options(conflicts.policy = list(warn = FALSE))

library(duckplyr)

options(duckdb.materialize_message = TRUE)
Sys.setenv(DUCKPLYR_FALLBACK_INFO = TRUE)

data.frame(a = 1:3, b = as.integer(c(1, 1, 2))) |>
  as_duckplyr_df() |>
  summarize(sum(a, na.rm = TRUE), .by = b)
#> Error processing with relational.
#> Caused by error:
#> ! Binder Error: No function matches the given name and argument types 'sum(INTEGER, BOOLEAN)'. You might need to add explicit type casts.
#>  Candidate functions:
#>  sum(DECIMAL) -> DECIMAL
#>  sum(SMALLINT) -> HUGEINT
#>  sum(INTEGER) -> HUGEINT
#>  sum(BIGINT) -> HUGEINT
#>  sum(HUGEINT) -> HUGEINT
#>  sum(DOUBLE) -> DOUBLE
#>   b sum(a, na.rm = TRUE)
#> 1 1                    3
#> 2 2                    3

data.frame(a = 1:3, b = as.integer(c(1, 1, 2))) |>
  as_duckplyr_df() |>
  summarize(sum(a), .by = b)
#> materializing:
#> ---------------------
#> --- Relation Tree ---
#> ---------------------
#> Aggregate [b, sum(a)]
#>   r_dataframe_scan(0x10daa72c8)
#> 
#> ---------------------
#> -- Result Columns  --
#> ---------------------
#> - b (INTEGER)
#> - sum(a) (HUGEINT)
#> 
#>   b sum(a)
#> 1 2      3
#> 2 1      3

Created on 2023-10-15 with reprex v2.0.2

@JavOrraca
Copy link
Author

@krlmlr This was definitely the fix and you can see below the significantly improved performance with duckplyr, thank you! 🚀 Below is the revised bench::mark() code including updated benchmark plots that remove na.rm = TRUE from sum() and completing the duckplyr pipelines with duckplyr::collect() for consistency across all approaches (returning the results as tibbles).

There are (often) times where I want to keep NAs in my data without removing them in some upstream operation... In the future, if duckplyr could support na.rm within base R summary statistics functions (e.g., sum, mean, min, max, including their row- and column-wise variants), that'd be a huge win. But either way, this is excellent and thanks for clarifying! 🙏

tic()
bnch <- bench::mark(
  min_iterations = 50,
  tibble_to_arrow = nyc_taxi_tibble |> 
    arrow::as_arrow_table() |> 
    dplyr::filter(passenger_count > 1) |> 
    dplyr::group_by(year) |> 
    dplyr::summarise(
      all_trips = n(),
      shared_trips = sum(passenger_count, na.rm = T)
    ) |>
    dplyr::mutate(pct_shared = shared_trips / all_trips * 100) |> 
    dplyr::collect(),
  tibble_to_duckplyr = nyc_taxi_tibble |> 
    duckplyr::as_duckplyr_df() |> 
    duckplyr::filter(passenger_count > 1) |> 
    duckplyr::summarise(
      all_trips = n(),
      shared_trips = sum(passenger_count),
      .by = year
      ) |>
    duckplyr::mutate(pct_shared = shared_trips / all_trips * 100) |> 
    duckplyr::collect(),
  tibble_to_dplyr = nyc_taxi_tibble |> 
    dplyr::filter(passenger_count > 1) |> 
    dplyr::group_by(year) |> 
    dplyr::summarise(all_trips = n(),
                     shared_trips = sum(passenger_count, na.rm = T)) |>
    dplyr::mutate(pct_shared = shared_trips / all_trips * 100),
  arrow_table = nyc_taxi |> 
    dplyr::filter(passenger_count > 1) |> 
    dplyr::group_by(year) |> 
    dplyr::summarise(
      all_trips = n(),
      shared_trips = sum(passenger_count, na.rm = T)
    ) |>
    dplyr::mutate(pct_shared = shared_trips / all_trips * 100) |> 
    dplyr::collect(),
  arrow_to_duckdb = nyc_taxi |> 
    arrow::to_duckdb() |> 
    dplyr::filter(passenger_count > 1) |> 
    dplyr::group_by(year) |> 
    dplyr::summarise(
      all_trips = n(),
      shared_trips = sum(passenger_count, na.rm = T)
    ) |>
    dplyr::mutate(pct_shared = shared_trips / all_trips * 100) |> 
    dplyr::collect(),
  duckplyr_df = nyc_taxi_duckplyr_df |> 
    duckplyr::filter(passenger_count > 1) |> 
    duckplyr::summarise(
      all_trips = n(),
      shared_trips = sum(passenger_count),
      .by = year
    ) |>
    duckplyr::mutate(pct_shared = shared_trips / all_trips * 100) |> 
    duckplyr::collect(),
  check = FALSE
)
toc()

autoplot(bnch)

1 million rows

10 million rows

100 million rows

500 million rows

@JavOrraca
Copy link
Author

And a quick follow-up... Typically you wouldn't care about NAs if you're summarise()-ing, however, I often find myself piping grouped data into a calc like summarise(count_na = sum(is.na(x)) that also includes other summary calcs. With the code that I shared above, I had to remove those NAs in the upstream filter(), but it'd be great to not have to do this with duckplyr. Thanks again.

@krlmlr
Copy link
Collaborator

krlmlr commented Oct 18, 2023

Thanks for the follow-up! Supporting sum(na.rm = TRUE) is definitely on our agenda.

@jrosell

This comment was marked as off-topic.

@krlmlr

This comment was marked as off-topic.

Sign up for free to join this conversation on GitHub. Already have an account? Sign in to comment
Labels
None yet
Projects
None yet
Development

No branches or pull requests

3 participants