What does the parameter "thin" mean? #382
Comments
|
The samples in an MCMC chain are not independent (see https://emcee.readthedocs.io/en/stable/tutorials/autocorr/ for example) so it can be redundant to store many non-independent samples. |
In the future, I will use the above methods to find the 'best' thin value. Am I right? |
|
No, that's not necessarily right and there's never going to be any "best" thin value. That can be a fine choice in some cases, but remember that the integrated autocorrelation time depends on the target integral so you might be throwing away information for some targets if you use that. I normally don't use the thin parameter, unless I'm storing a large number of chains and want to save on hard drive space. |
General information:
Problem description:
I'm wondering what does the parameter 'thin' exactly mean? I find for different thin value, the result is different.
So I'm confused what value should I set to the parameter 'thin':
flat_samples = sampler.get_chain(discard=100, thin=?, flat=True)?let steps= 5000, walks=32, discard=100, and let
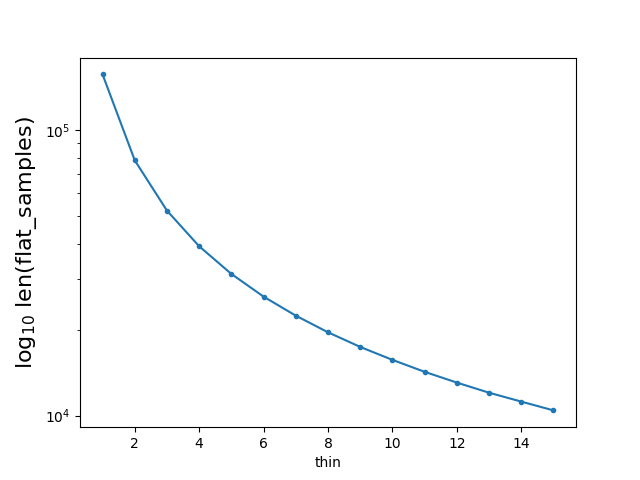
flat_samples = sampler.get_chain(discard=100, flat=True, thin=i)If I denote the size of flat_samples when thin= i as ' flat_samples| thin= i ', I found:
flat_samples | thin=1 = (5000-100)*32 =156800
flat_samples | thin=i = [ (5000-100)/thin] * 32
But I still do not understand the meaning of the parameter 'thin'.
Why should one 'thin' a relatively big sample to a small sample?
Code to show my question:
By running the above code, I got a figure showing the relation between the value of thin and len(flat_samples):
Then I made a corner plot by setting thin=1
I made another corner plot by setting thin=15, I found the figure is different:
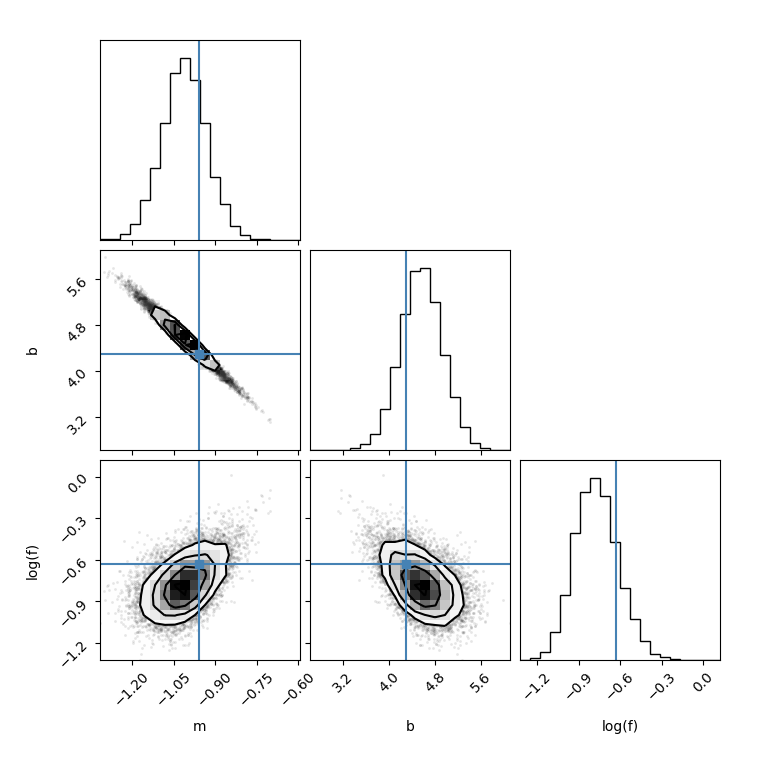
flat_samples = sampler.get_chain(discard=100, thin=15, flat=True)Then I run the following code, I found for different thin value, the results is also different.
The text was updated successfully, but these errors were encountered: