Introduction of raster extent #77
Assignees

Comments
|
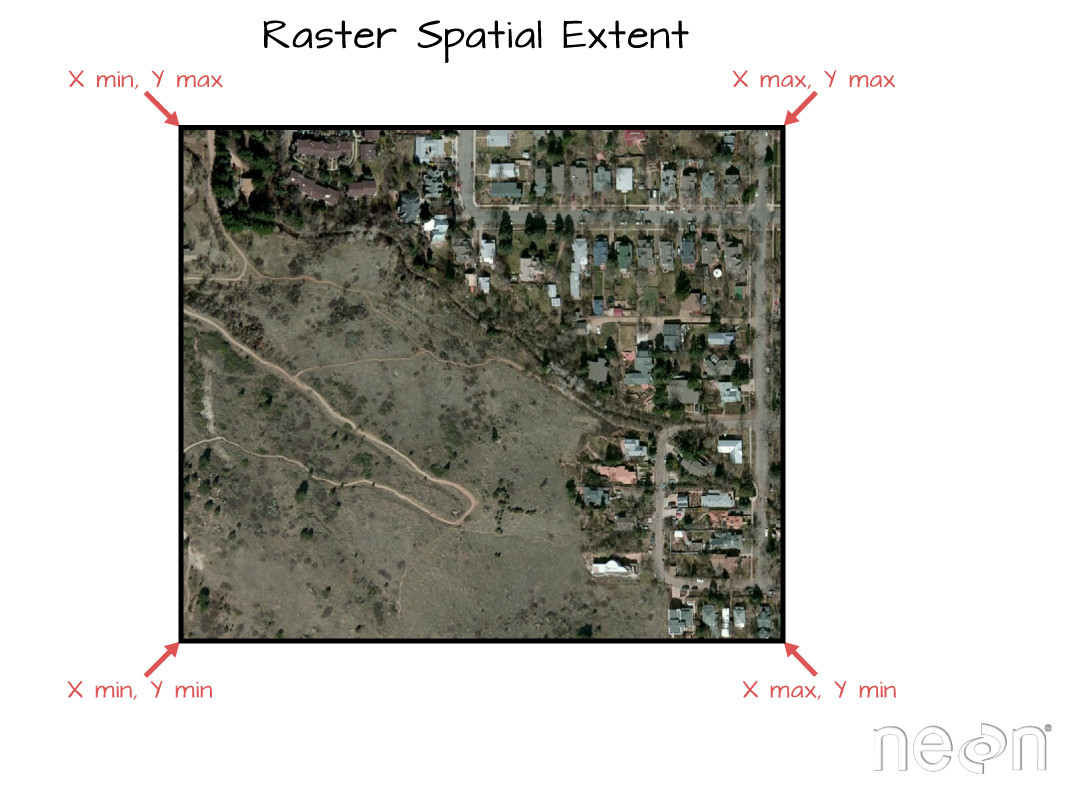
Thank you for this sensible suggestion. Introducing vector objects at this stage while the discussion is about raster extent undermines the flow of the lesson. The explanation also gets confusing since technically there is a slight difference between definitions of vector and raster extents. I also like the idea of providing an image extent example overlaid on an outline background map. The Xmin.Ymin & Xmax,Ymax coordinates (used to define a raster extent) can also be shown as in this example https://raw.githubusercontent.com/NEONScience/NEON-Data-Skills/dev-aten/graphics/raster-general/sat_image_corners.png |
Sign up for free
to join this conversation on GitHub.
Already have an account?
Sign in to comment
This is a minor suggestion about how raster extent is introduced, in https://datacarpentry.org/organization-geospatial/01-intro-raster-data/index.html#extent
The image introduces point, line and polygon examples or R spatial objects as having extents - I wonder if the lesson could avoid introducing vector objects at this point? They will be introduced in the next episode.
Instead, the example could show the extent of some raster data - perhaps a single satellite image tile, perhaps overlaid on an outline background map to show the geographical context (coastline or admin boundary) - something like this image from https://scitools.org.uk/cartopy/docs/latest/matplotlib/advanced_plotting.html#images
The text was updated successfully, but these errors were encountered: