Skip to content
New issue

Have a question about this project? Sign up for a free GitHub account to open an issue and contact its maintainers and the community.

By clicking “Sign up for GitHub”, you agree to our terms of service and privacy statement. We’ll occasionally send you account related emails.

Already on GitHub? Sign in to your account

comparing single cell and single nuclei datasets #279

Open
binyaminZ opened this issue Dec 29, 2022 · 3 comments
Open

comparing single cell and single nuclei datasets #279

binyaminZ opened this issue Dec 29, 2022 · 3 comments

Comments

@binyaminZ
Copy link

Hi!
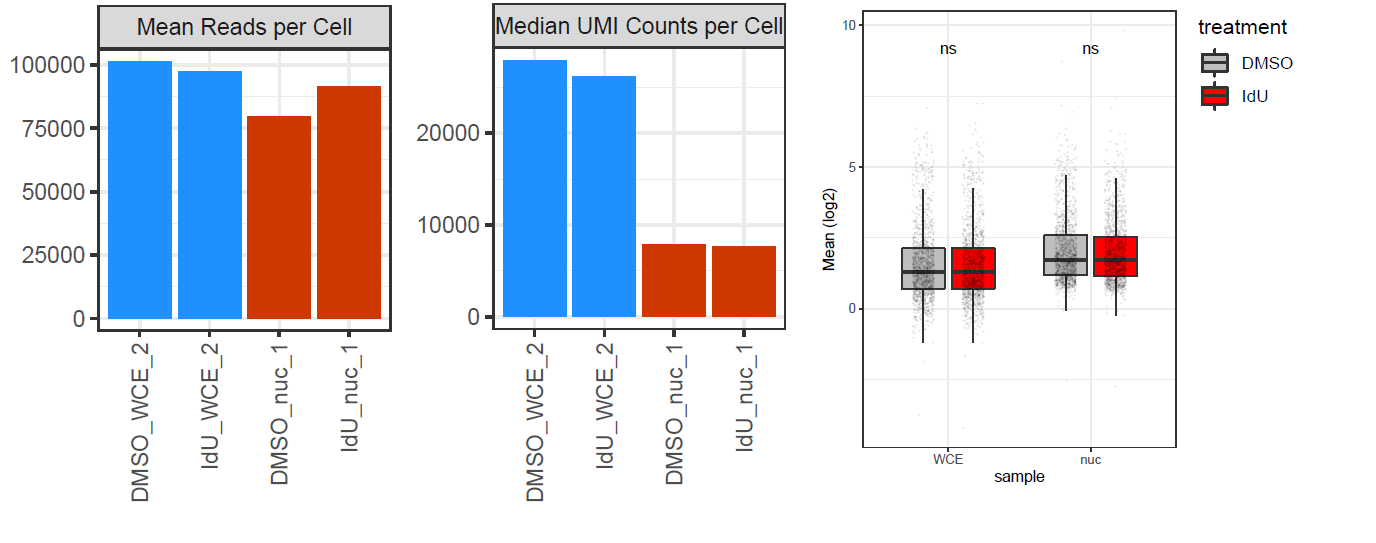
I am trying to compare mean and noise values between two datasets, one is single cell and one is single nuclei. both runs were performed on the same platform, with identical conditions, and the same cells, the only difference is the nuclei isolation process. The problem is that nuclei (nuc) and whole cells (WCE) have different RNA content, and the 10x methodology I used (droplet-based) doesn't allow spike-ins. So I end up with very different sequencing saturations - for WCE it's around 40%, while for nuc it's around 65%. Correspondingly, the read count to UMI count ratio is very different (see plot below, CellRanger output stats). Finally, mean expression values in WCE and nuc are not comparable (see right plot below, normalized means across cells).
image
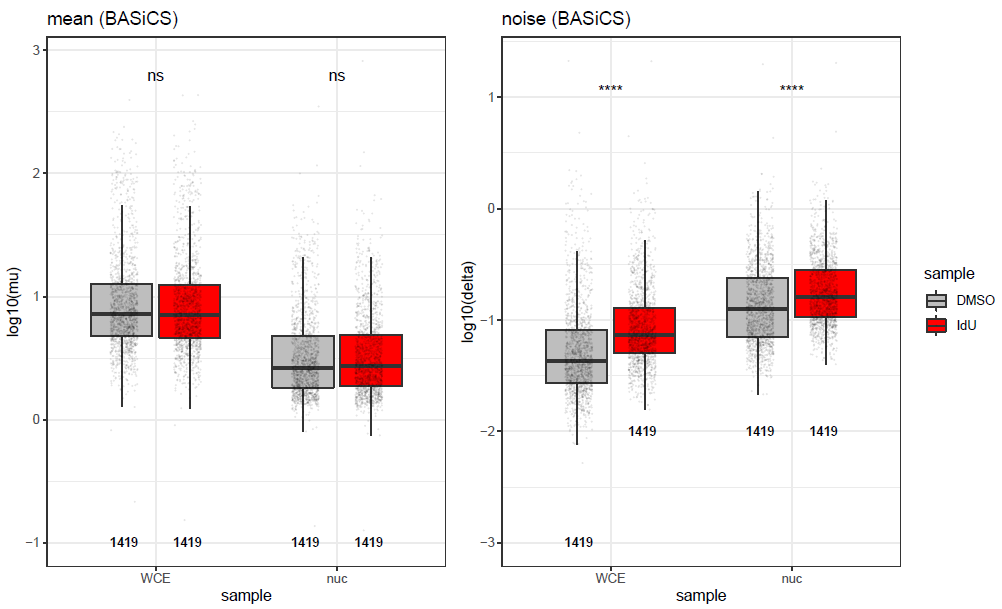
I tried to apply BASiCS to the data, but obviously it doesn't help, as the difference in mean expression values is strongly increased (in the opposite direction), and overdispersion values are even less comparable:
image
It seems to me that a simple scaling factor applied to the count matrices can solve this problem and "normalize" the WCE and nuc datasets, however, I'm not sure what would be a good way to estimate this factor (maybe by just comparing median UMI counts in each sample?). What would you do to address this? Does BASiCS have a built-in option for such correction? Or would you normalize manually?
Thanks!
Binyamin

@binyaminZ
Copy link
Author

Update:
When I tried applying BASiCS_TestDE to the chains, it appears that it does handle the difference well when comparing the means, as I get mostly no change in mean expression (left plot below). I wonder whether I can trust the right plot, showing a global increase in noise for all genes in the nuc data. Assuming the data is normalized for the different depths, would you conclude that there is more biological noise in the nucleus than in the whole cell?
Finally, are the values in testDE@Results$Mean@Table and testDE@Results$Disp@Table columns 3-4 the normalized values?
Thanks!
Binyamin

image

@alanocallaghan
Copy link
Collaborator

For the second plot, I'd suggest looking at residual overdispersion rather than just overdispersion - if there's a global decrease in mean expression levels in the snRNAseq data relative to scRNAseq data (as you'd expect), this will tend to be accompanied by an increase in overdispersion. The offset correction of mean expression levels performed in BASiCS_TestDE (or manually with BASiCS_CorrectOffset) will remove this global shift in mean, but it won't do the same for overdispersion. For overdispersion we rely on inferring the global relationship between mean and overdispersion in the dataset and removing this effect to produce the residual overdispersion measure of noise that is not affected by the overall confounding between mean expression level and overdispersion/noise.

@binyaminZ
Copy link
Author

Hi Alan,
Thanks for this response! I'm back to looking at my data, trying to understand better your response. BASiCS_TestDE corrects for a global shift in mean, I clearly see this. I understand that by looking at the residual overdispersion, the global difference in noise will be canceled. However, I would like to test whether the difference in noise between my nuclear and cytoplasmic samples is larger or smaller than expected by the known difference in RNA concentrations between the samples. To explain it better (see the plot below), normalizing the mean and the overdispersion brings the circle and the square in the middle plot together on the Poissonian diagonal:
image

I am interested in testing whether the noise in the cytoplasm is globally amplified or attenuated compared to the nucleus. My current analysis shows that the nucleus has much more "noise" (overdispersion), but I suspect this is just because the mean level is much lower. Can BASiCS help me in this?

Thanks!
Binyamin

Sign up for free to join this conversation on GitHub. Already have an account? Sign in to comment
Labels
None yet
Projects
None yet
Development

No branches or pull requests

2 participants