visualization of optical flow & lead field vector on cortical surfaces #277
Comments
|
Hi all, I went through @tmedani's code for lead_field vizualisation, it is actually very similar to what was coded for optical flow. The differences I observed are:
The great advantage of view_leadfields over optical flow vizualisation is the user interface through keyboard shortcuts. A generalization of this interface to the display of vector fields in Brainstorm could be a good improvement of the software. Do you agree ? Thanks,
|
|
Thanks Leo:
I agree.
Sylvain.
-
…________________________________
From: LeoNouvelle <notifications@github.com>
Sent: Monday, April 6, 2020 11:44 AM
To: brainstorm-tools/brainstorm3 <brainstorm3@noreply.github.com>
Cc: Sylvain Baillet, Dr <sylvain.baillet@mcgill.ca>; Mention <mention@noreply.github.com>
Subject: Re: [brainstorm-tools/brainstorm3] visualization of optical flow & lead field vector on cortical surfaces (#277)
Hi all,
I went through @tmedani<https://github.com/tmedani>'s code for lead_field vizualisation, it is actually very similar to what was coded for optical flow. The differences I observed are:
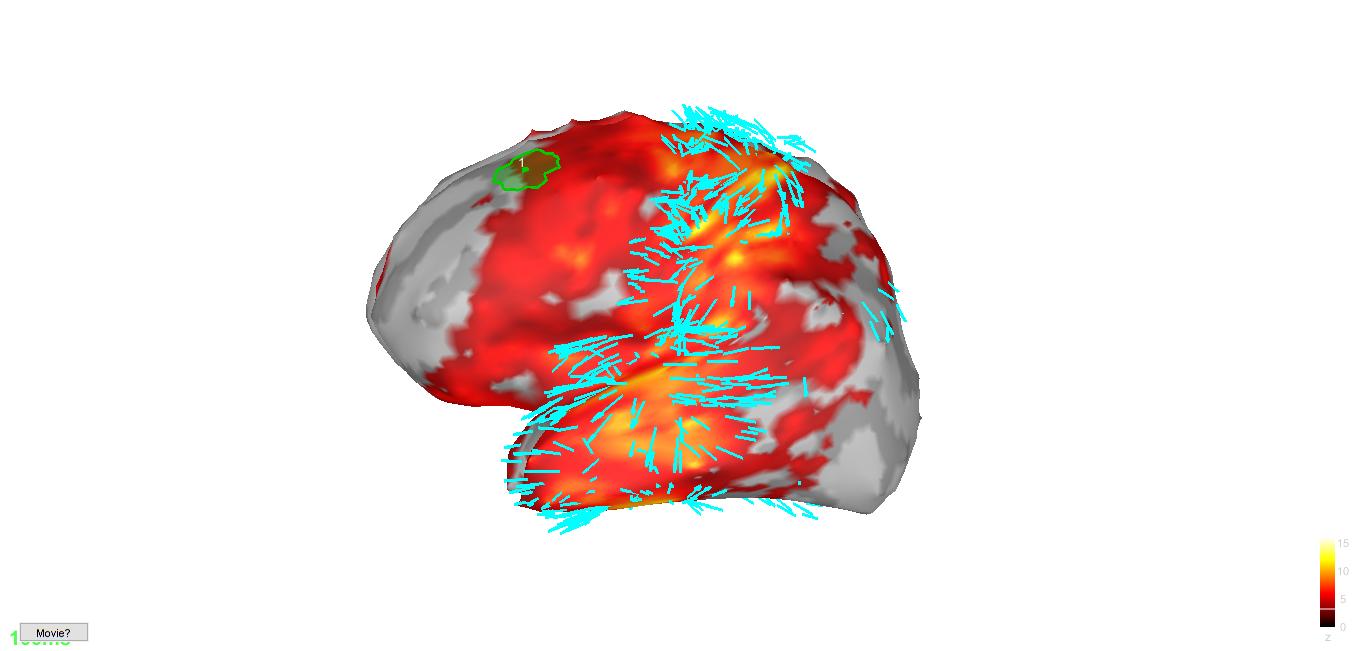
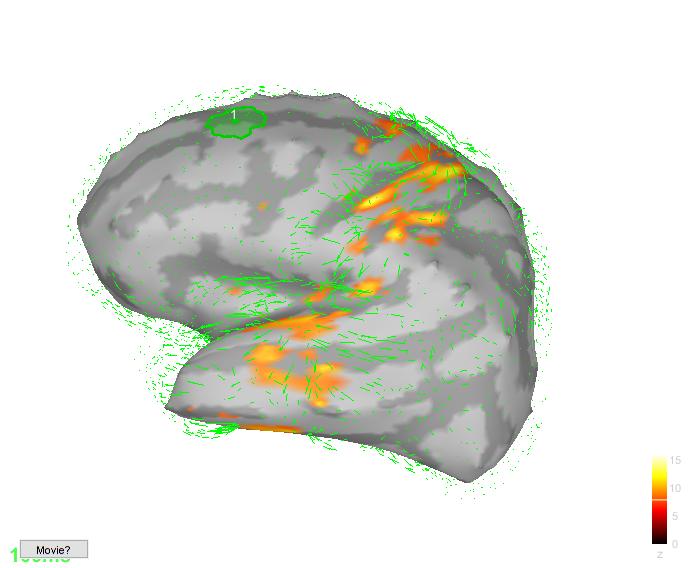
* For lead field, the flow is displayed on each vertice of the cortex // For optical flow the vectors are filtered so that only those of highest norm are visualized.
* For lead field, the vector's display scale is readapted at each image // For optical flow the vectors are scaled across each image of the time interval to get a sense of when optical flow is most important. This induces visualization problems, the data can be unreadable.
The great advantage of view_leadfields over optical flow vizualisation is the user interface through keyboard shortcuts. A generalization of this interface to the display of vector fields in Brainstorm could be a good improvement of the software.
Do you agree ?
Thanks,
[view_panel_optical_flow(initial_view)]<https://user-images.githubusercontent.com/61158704/78577320-e58de600-77fb-11ea-80b3-41259ef610a3.jpg>
[view_leadfields]<https://user-images.githubusercontent.com/61158704/78577322-e6267c80-77fb-11ea-8dea-9beea12b2895.jpg>
—
You are receiving this because you were mentioned.
Reply to this email directly, view it on GitHub<#277 (comment)>, or unsubscribe<https://github.com/notifications/unsubscribe-auth/AEOWKPJ63DSKTNBYN2WPFTDRLH2FRANCNFSM4L3BSRYA>.
|
|
Hi everyone, It could be intersting to precise the features we would like to include in the brainstorm gui for brainstorm vizualisation. Here is a list of a few features which would eb interesting from the optical flow perspective:
Some of the features above such as vector vield filtering or vector field smoothing could havec several implementations.
Do you have any other ideas of useful features to include ? In particular, @tmedani what would be useful to add for the display of lead fields ? Thanks, Léo |
|
Hi @LeoNouvelle
Are your codes available somewhere?
indeed, we can use it to add more functions, but it can have some limitations.
For the 1, 2 and 4, I think it's the easiest to integrate. Also, what do you mean by smoothing (5)? What are the different inputs data that you need in order to display this figure? Could you share your code? Thank you. |
|
Hi @tmedani ,
I only have the codes on my local computer. I'm not sure I can/should upload code on the Brainstorm github... Perhaps it's best if you have an email adress I can send you the code + data + explanations on how to use it with brainstorm ?
For all the figures the only input I need is the brain tessalation (Surface File in Brainstorm) and the optical flow vector field (or the cortical activity which I can process in optical flow).
I totally agree.
The the optical flow data is noisy even when processed on smoothed sources so I am looking into applying a smoothing filter on the vectors to improve results and vizualisation. It would be nice to be able to adapt the smoothing of the vector field from the user interface while looking at it.
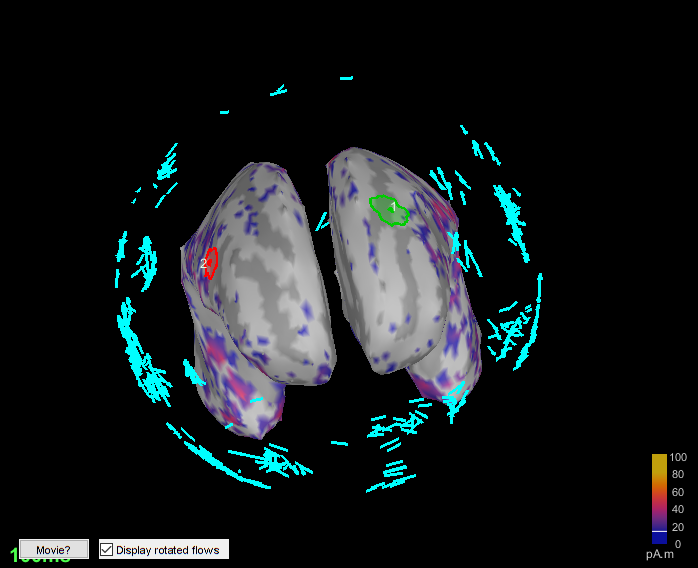
The vector field inflating would projet the vectors from the brain's surface on to a smooth, convex sphere outside the brain (it's the case in the last image I imported). The purpose is to visualize all the vectors without any being hidden by the brain's irregularities (some vectors can be pointing towards the inside of the brain and hidden). it is less useful if we only project on fully smoothed brain surfaces. About the user interface, would it be complicated to adapt your work with the keyboard shortcut to a visual command pannel ? Because I was thinking it could be more adapted for actions such as vector field filtering. We could integrate the pannel to the Brainstorm pannel as @martcous suggested during the call ? Thank you, Léo |
Hi guys, I don't think this is too complicated, so long as the parameters can be represented with one of the basic Java Swing GUI components (such as buttons, sliders, text fields, etc). I can definitely help with this once the parameters are set in stone and callback functions have been written. Depending on how many there are, we could add it to an existing panel (Surface?) or create a new one. You can have a look at the panel_surface.m function to see how it works if you're curious. Thanks! |
|
Indeed, together with Martin, we can help you with the interface. Please avoid adding buttons or other controls in the figures. Examples for separate panels:
There is a panel_opticalflow.m and "Plug-in > Optical-flow" popup menu when you right-click on a "full matrix" source file... Is this what you are using? |
|
Hello all, Thank you @ftadel & @martcous for your help
@LeoNouvelle could you either send it by email or share a Gdrive/dropbox link here?
@ftadel : I can't reproduce this process, what do you mean by source file? I don't know how @LeoNouvelle do it for now, |
Right-click on some recordings > Compute sources [2018] > Show details : select "Full results". @sbaillet Can you tell us what this was about? |
Thank you @ftadel, |
|
Hello everyone, Thank you @martcous @ftadel for your help !
Indeed, it's the function I've been using for visualizing vector fields. @tmedani in fact you are also right because I mainly work outside of Brainstorm on re-processing the flow field I want to visualize. I then reimport the data in Brainstorm and visualize it using the optical flow plugin @ftadel mentionned. I keep switching in/out of Braisntorm which is quite time consuming.
Of course, here is a link towards useful functions and data : https://drive.google.com/open?id=1zV9YgUcP8WV4zcv6j-ET-LvJEWXjPJE6
Thanks @martcous, I will start studying the function ! |
|
@LeoNouvelle Are these developments you make with the goal of distributing them with Brainstorm later, or is this just for one single specific project? Have you already presented this at one of our biweekly Brainstorm meetings? (I'm sorry if this is one I missed, in that case maybe we could catch up with a short skype meeting) |
|
Hi Francois:
This is an effort to revive and update the optical flow developments we’ve done over the years, with now full integration in Brainstorm.
Sylvain.
|
|
Hi @LeoNouvelle, I have tried with your files but it does not work correctly. I tried to change the code but it's not efficient ... Maybe we need to set a discussion together and show me how you use it. Thanks |
|
Hi @tmedani, Sorry to hear that it didn't work. Perhaps I made changes in other functions related to panel_opticalflow_ on my computer I don't remember. I would be happy to show you. When are you available ? I am pretty much availbale at any time these days ... See you soon, Léo |
|
Hi Leo, ok, we can have a discussion tomorrow, I will send you a Zoom link and the time by email. best |
|
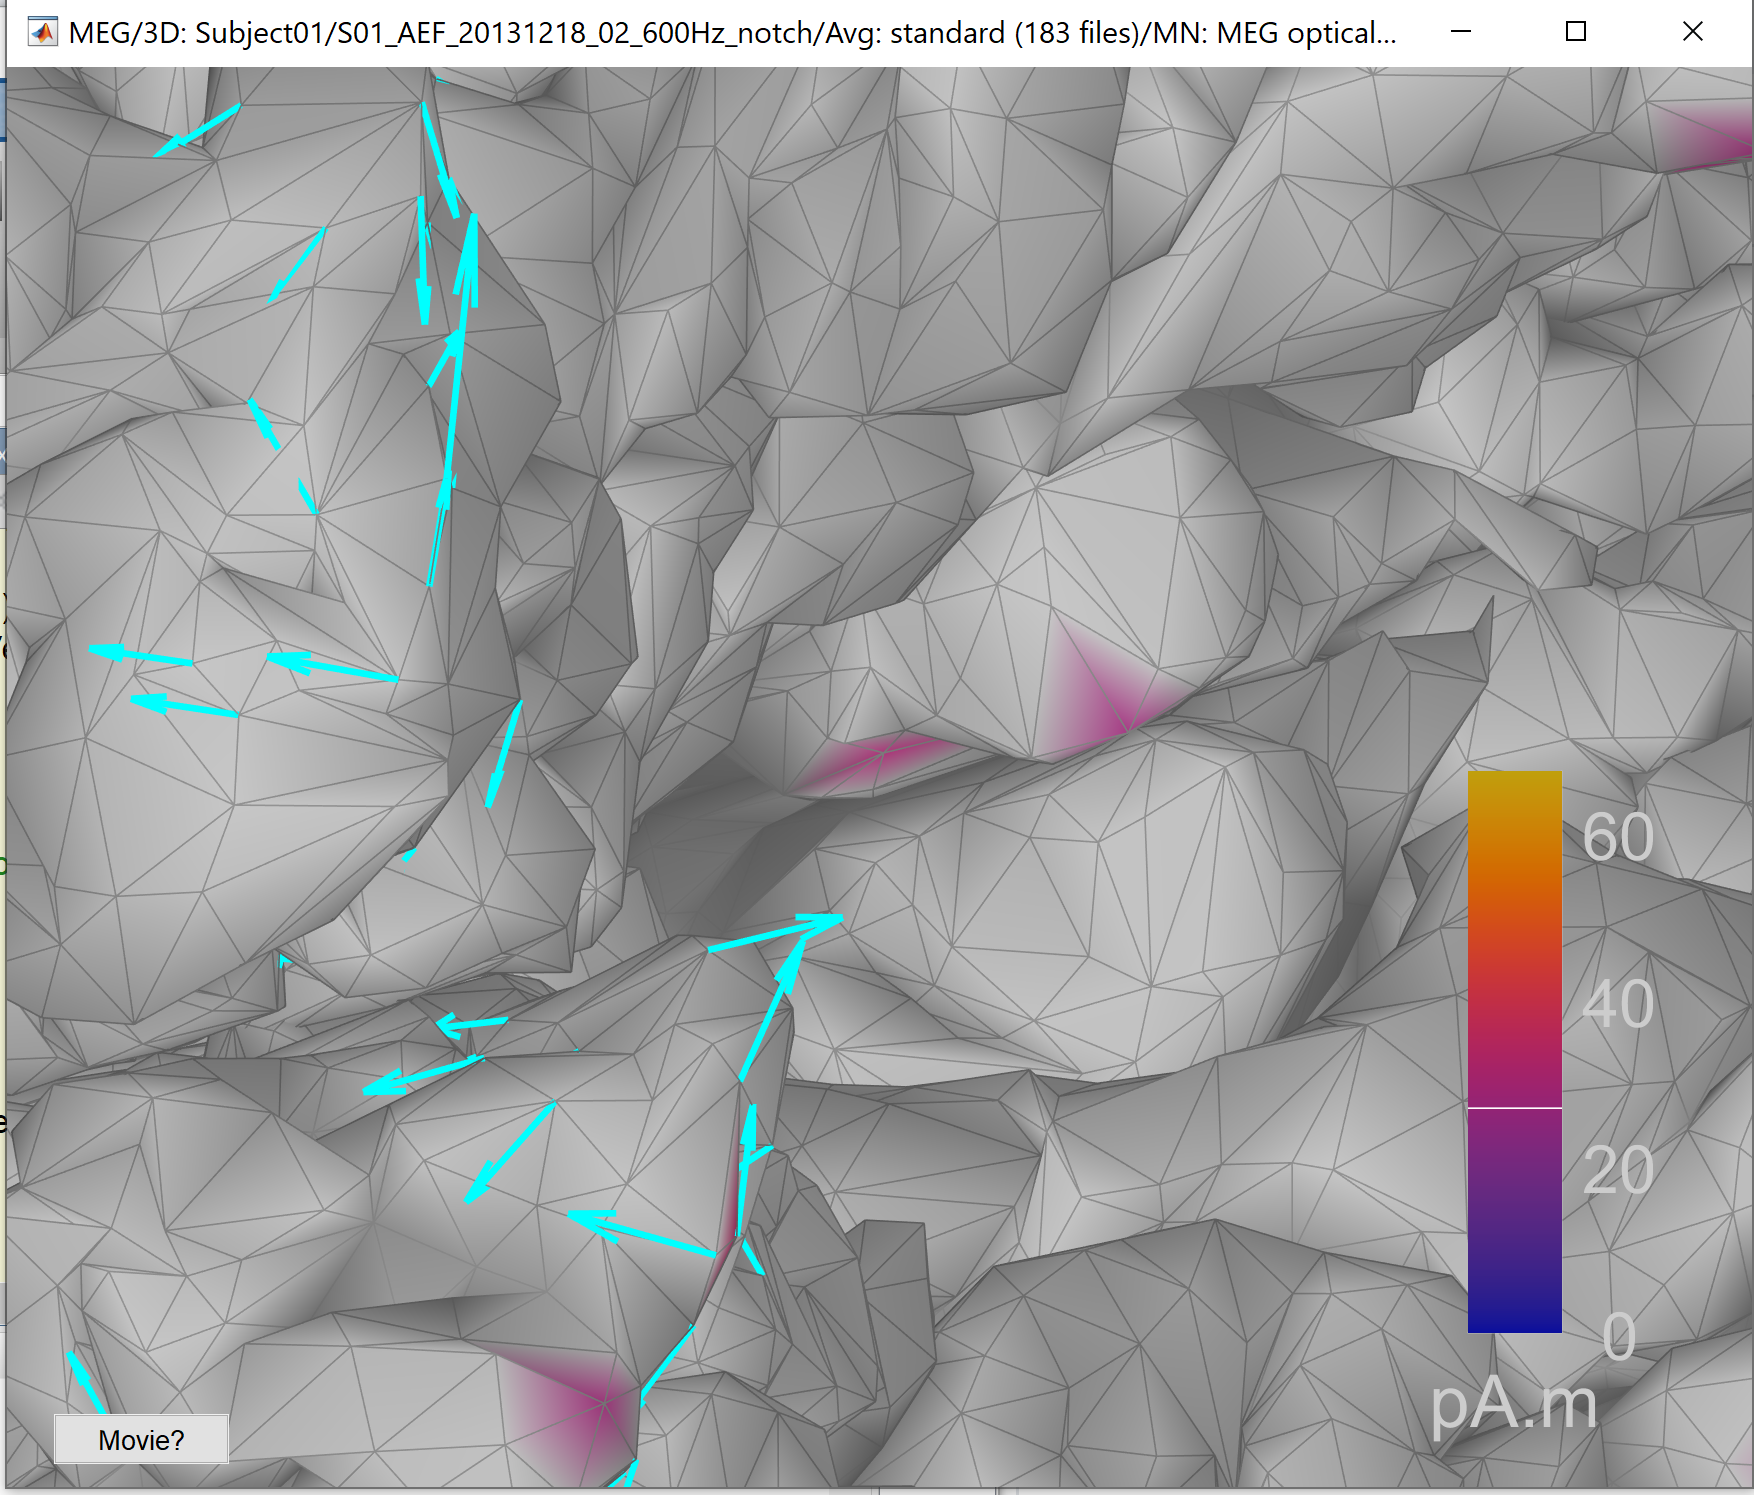
Hi @LeoNouvelle it seems that the vectors are not displayed on the cortex vertices but moved on the normal direction of the vertices.
Regarding the second function "quiver3" at line 656 it seems to be used to export the results (need to check). So, for now, the main modifications would be around the sub-function "PlotOpticalFlow" |
|
Hi Takfarinas, Glad you were able to reproduce the process ! Thanks for the figure, it looks good. So for the vector representation there isn't a problem of mismoatching as we were afraid of but a slight shift along the vertices Normals. (By the way, I just checked and the vertices normals do change and adapt when we apply a smoothing on the surface). Also, I have attached the files I said I would send you to the google drive (24/04 file): I agree, the interesting part of the code is the PlotOpticalFlow sub-function for now. The last quiver3 you talked about is for a sub-function ("Print Stable/Transition States" on the panel) which isn't useful yet. I went (brieffly) through the panel_surface file you were talking about @martcous. I think I got a sense of the code. I also saw there are panel_record, panel_filter and panel_scout functions. I guess the final goal is to add a panel_vectors to the software. I will try to go over it again and come back with a few questions if that's all right ? Thanks, Léo |
Not necessarily, it depends how many things you have to put in there. It could also be floating panel (not docked in the Brainstorm main window). Would you be available for presenting this at our next Brainstorm meeting (May 6th)? |
Yes I am available on May 6th, @sbaillet already asked me to present.
Yes, I agree of course. |
|
Hi everyone, I just wanted to reactivate the conversation after the conversation we had at the brainstorm meeting wednesday. (5 and 6 were more ideas I proposed but didn't really seem essential. 5 wasn't actually well defined.) @martcous @ftadel, do those features seem ok to add to Brainstorm without to much trouble ? What would be the best user interface to implement ? Thank you Léo |
|
Hi Léo, Thank you for the summary. Is it possible to detail the type of object you would like each option Also, did we decide that we would create an entirely new panel for optical flow, or add it to one dynamically like the Display panel? Thanks! |
|
I've been working recently on very similar things with the display of the FEM conductivity tensors, so I have a good idea of what are the representation capabilities of the various graphic objects capable of drawing lines in Matlab. We will need a clear test case in order to discuss what we want to implement. Second step: we need to separate the display options from the computation options. For example, smoothing or inflating a vector field do not seem like simple display options to me...
A fixed size maximum vector with all the other vectors scaled wrt the max norm is not a good option for you? You'd need to set the actual length of the maximal norm on which all the vectors are scaled? Similarly to the 2DLayout display options:
Same thing: This is a display option that would be called once or twice, not continuously (like the "smooth surface" or "transparency" sliders).
This is achievable with the patch objects. This is the way I implemented the colored lines for representing the FEM tensors:
The use case and implementation of the filtering needs to be better described. General design considerations Are you planning to write a tutorial for these tools? |
|
Is this moving forward? |
|
yes.
|
|
Any update on this front? |
|
the todo list is getting bigger, and pushing this one for later, |
|
We’re actively working on the research end of this dossier. Software deployment will be next.
Cheers,
Sylvain.
|
|
@sbaillet Any updates? |
Hi all,
Following the discussion that we had with @sbaillet @martcous and Leo (joining soon), regarding the visualization of the vectors flow on the cortical surface.
We decided to open this thread to discuss and to adapt the 'view_leadfield' for the visualization of the optical vector flow, improve it and add functionalities.
Leo will start testing and share its results and feedback soon.
Thanks
The text was updated successfully, but these errors were encountered: