Bar plots with LogScale don't show up properly #1300
Assignees

Labels
Comments
|
Dear all, Is there anyone who could take a look and give us feedback about this and #1219? As a user who can't really help with the development, I don't have intention to put pressure but I think the use cases in these tickets are pretty important to be addressed. |
|
Hi, x = [i * 3 for i in list("abc")]
y = np.abs(np.random.randn(10) * 100)
sc_x = bq.OrdinalScale()
sc_y = bq.LogScale()
scales = {"x": sc_x, "y": sc_y}
bars = bq.Bars(x=x, y=y, scales=scales, opacities=[0.1], type="grouped", base=1)
ax_x = bq.Axis(scale=sc_x, grid_lines="none")
ax_y = bq.Axis(scale=sc_y, grid_lines="none", orientation="vertical")
bq.Figure(marks=[bars], axes=[ax_x, ax_y], title="Linear scale")
|
17 tasks
|
I think #1423 fixes this, although I will only work for non-negative values and a non-negative base (see #1423 (comment) ) |
Sign up for free
to join this conversation on GitHub.
Already have an account?
Sign in to comment
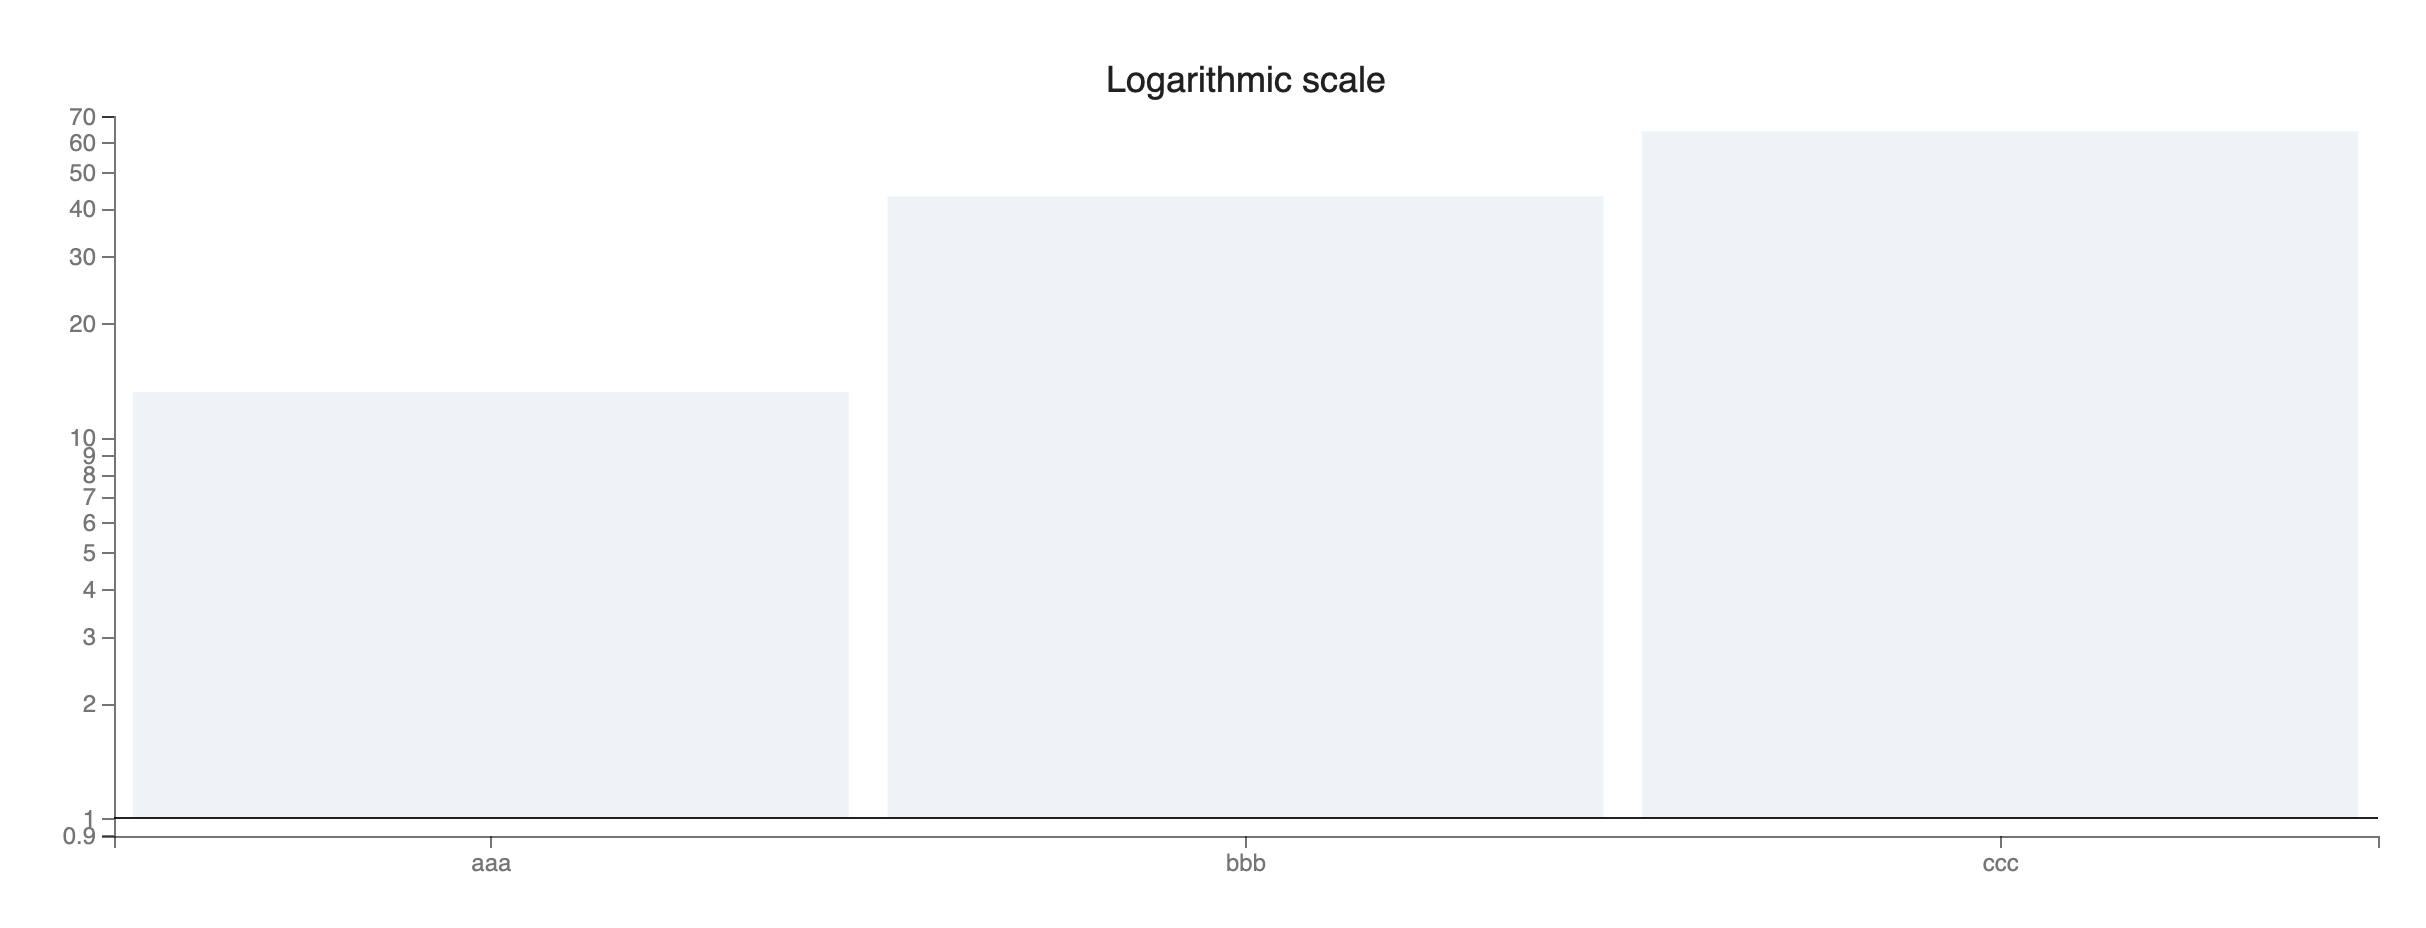
Hi,
Describe the bug
I can't make Bar plots work using a LogScale scale.
I imagine the problem must be connected with the need for the minimum value of a LogScale be non-negative. It's similar but not the same as #1219.
To Reproduce
Here's a simple working example using a LinearScale:
This example doesn't work at all:
And setting the minimum value for the LogScale leads to weird behaviour:
Expected behavior
I would expect that Bar plots should be possible using a LogScale, and maybe return an error if the dataset doesn't allow it (if values are non-positive).
Additional context
Tested on bqplot 0.12.20.
Thanks!
The text was updated successfully, but these errors were encountered: