LocusCompareR is an R package for visualization of GWAS-eQTL colocalization events.
Use the following commands to install LocusCompareR. If you don't have devtools, uncomment the first line to install it.
# install.packages("devtools")
devtools::install_github("boxiangliu/locuscomparer")
To illustrate the use of locuscompare, we use the GWAS dataset from Nikpay et al. (2015) and the coronary artery eQTL dataset from GTEx v7 at the PHACTR1 locus:
library(locuscomparer)
gwas_fn = system.file('extdata','gwas.tsv', package = 'locuscomparer')
eqtl_fn = system.file('extdata','eqtl.tsv', package = 'locuscomparer')
locuscompare(in_fn1 = gwas_fn, in_fn2 = eqtl_fn, title1 = 'CAD GWAS', title2 = 'Coronary Artery eQTL')
The output from the main function is a figure like the following:
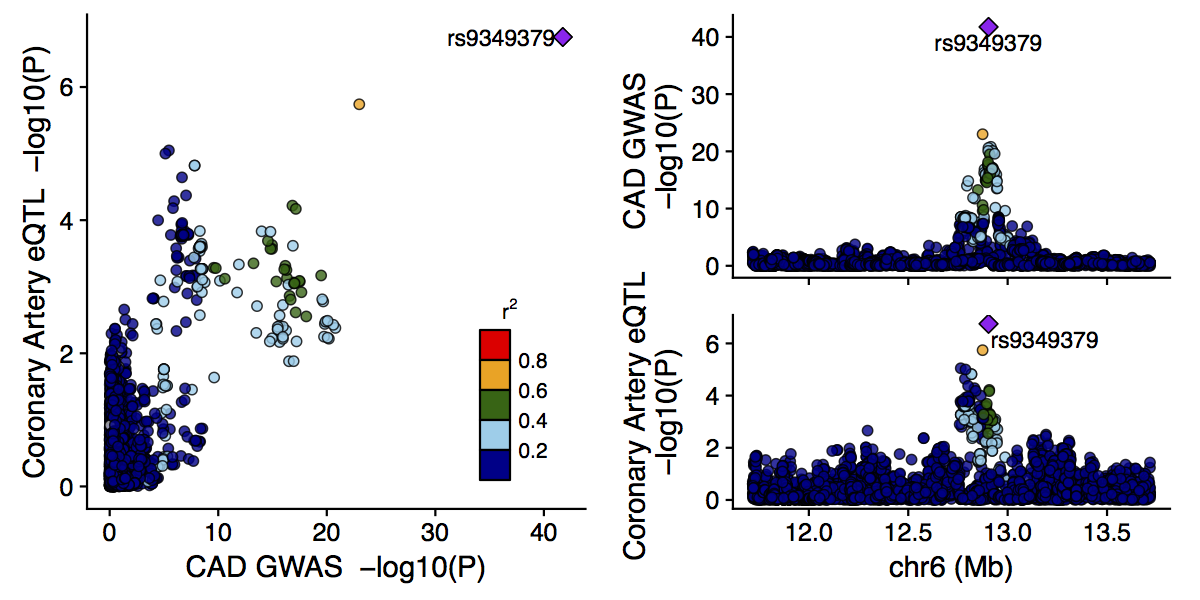
The labeled SNP is the lead SNP (in this case for both studies), and other SNPs are colored according to their LD
The input to locuscompare::main() is a two-column tab-delimited text file with two columns:
- rsid
- pval
Here is an example file:
rsid	pval
rs62156064	0.564395
rs7562234	0.399642
rs11677377	0.34308
rs35076156	0.625237
You can download the example files below: GWAS and eQTL datasets.
Then run the following commands:
library(locuscomparer)
gwas_fn = 'path/to/gwas.tsv'
eqtl_fn = 'path/to/eqtl.tsv'
locuscompare(in_fn1 = gwas_fn, in_fn2 = eqtl_fn, title = 'GWAS', title2 = 'eQTL')
To view documentation for each function, type ?[function name] in the R console.
LocusCompareR current export the following functions:
Data munging
assign_color: Assign color to each SNP according to LD.get_lead_snp: Add a column of SNP labels to input data.frame.get_position: Append two columns, chromosome (chr) and position (pos), to the input data.frame.
Plotting
locuscompare: Make a locuscompare plot.make_combined_plot: Generated a combined plot with two locuszoom plots and a locuscompare plot.make_locuszoom: Make a simple locuszoom plot.make_scatterplot: Make a scatter plot (called the LocusCompare plot)
Data loading
read_metal" Read association summary statistics from file.retrieve_LD: Retrive SNP pairwise LD from database.
If you use locuscompare, please cite the following paper: https://www.nature.com/articles/s41588-019-0404-0
Boxiang Liu, Michael J. Gloudemans, Abhiram S. Rao, Erik Ingelsson & Stephen B. Montgomery (2019) Abundant associations with gene expression complicate GWAS follow-up, Nature Genetics