Two men, one cutting a silhouette:

from the Collection of the Metropolitan Museum of Art.
Sequence matters.
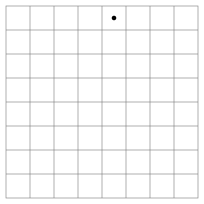
- How many ways are there to process 3 x 3 pixels?
- How many ways are there to walk a grid of 3 x 3 pixels, visiting each pixel once?
- When will the sequnce influence the result of the image processing?
Most popular way to iterate over pixels + easily implemented.
- inspired by good old raytube television
- single or nested for-loop.
Pixels can be processed in any order you like.
- Self Avoiding Walks
- Look-Up Table to get pixel position from pixel index (Custom walks)
- Formula to get pixel position from pixel index (Fractal space filling curves)
Pixel processing order depending on the input image!
Examples
- filling algorithms
- contour detection
- peeling off layers of pixels
- Using the GPU to speed things up
- Which Pixel-Operations can be run in parallel, which can't?
- Scan the Image removing pixels (pixel templates)
- How many pixel templates do you need?
- How do you represent them?
- Make sure to preserve the topology
- Walk around the Structure, peeling of layer by layer.
- Get the distance of each pixel to the border
- Pixels with maximum distance = Skeleton Pixels
- Weighted Skeleton can be used to reconstruct the original shape!
- See: Grassfire Transform
- Setting Pixels on Fire
- Metrics: Measuring Distances, Math Style.
- Metrics based on Moore + VanNeumann Neighborhoods
- Approximating the Euclidian Metric
What are skeletons?
Topological Skeleton on Wikipedia
The original Idea goes back to Blum's paper on Biological Shape and Visual Science.
It's a fantastic paper. Read it!
Possible Problems:
- Connectedness of bones
- Small pertubations may lead to erraneous bones
- Similar Shapes may result in different skeletons
Recently a couple of variants have emerged, to take care of these problems:
- Shock Graph (See Grassfire Transform)
- Flux Graph Flux Graphs for 2D Shape Analysis, Morteza Rezanejad 2013
Things you can do with them...
- Identify "identical" Shapes
- Measure Shape Similarity
- Create Intermediate Shapes
- etc...
Starting with this lecture, we will be inventing our own algorithms.
At the same time your processing sketches should be able to visualize the
algorithms you developed.
Visualization of a Knight's Tour:
You can animate the process, by moving one step forward with every single
draw loop. You can use saveFrame("Movie-####.png") to save individual frames, and then turn those into a video with your favorite movie editing software.
A Debugger Sketch lets you walk through the algorithm in a step by step manner. Provide the user with keyboard shortcuts to walk back and forth in the history of the algorithm.
For going back in time you either need to keep track of previous steps (and reverse them) krrp track of previous states, or simply calculate all the steps over and over.
- Connect successive loci of activity with a line
- Color pixels based on time, state ...
- Show several runs of your algorithm side by side
- Show the result of your algorithm when applied to different inputs
Exercises can be found here.
Solutions can be found here.
- Biological shape and visual science (part I), Journal of Theoretical Biology, 1973
- Shape description using weighted symmetric axis features, Pattern Recognition, 1978
- Flux Graphs for 2D Shape Analyisis, PHD Thesis, 2013