SignalR Memory keeps increasing #4159
Comments
|
Any update on why this is happening? |
|
same issue here |
|
Can you use a memory profiler to determine which objects are being left alive? SignalR does intentionally hold messages in memory after a client disconnects in order to be able to re-broadcast those messages in the event of a reconnecting client. These messages are stored in a ring buffer so that it only buffers a fixed number of messages, but it is entirely expected that memory would not be released as soon as a client is disconnected. Are you hitting specific performance issues directly attributed to this memory usage? SignalR should also be using weak references to ensure that this memory is freed when the Garbage Collector needs additional space. Can you provide information on the failures you are seeing? |
|
Likely #3850. |
|
As described above, this looks to be just the standard SignalR message buffer. SignalR uses a fixed-size ring buffer to hold messages (so old messages are only removed when space is needed) in order to allow messages to be replayed to clients that reconnect. You can modify this buffer size using the IConfigurationManager.DefaultMessageBufferSize option. Closing this as we haven't heard any updates on the objects that are staying alive. Feel free to comment further if you have question. We can always re-open this if there's an issue to resolve! |
|
I still think this is a critical bug and that this issue should not be closed. It is a big memory leak that can easily consume a lot of memory and crash an application due to an OutOfMemoryException. Especially because the default value of DefaultMessageBufferSize is 1000 messages per Hub. Right now, I'm struggling with that. |
|
In my situation our web app (hosting SignalR only) never releases strings referenced by
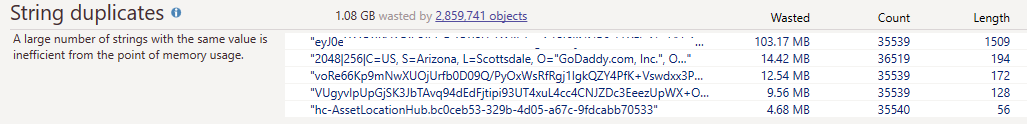
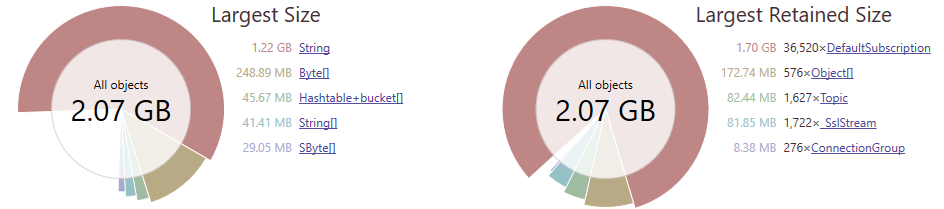
Memory Usage In my case I don't believe it has to do with queued messages. It looks like we have 132k allocated messages, but they are only taking up about 11MB of memory. Okay last edit I hope... Here is the best view that I've found in dotMemory about the breakdown of memory usage. |


|
Hi, ` } |
|
Hi, So, I think this is a SignalR bug. This is the modified code: while (true) |
did you find any solution? Let us know i'm also looking for it @clarghi |
Hi, no. The code is complex and almost not commented :-( |
|
We had a memory leak in our SignalR code at Flipdish. Some snippets from our Slack thread about this:
We made a change to our system to use the
|

Hi,
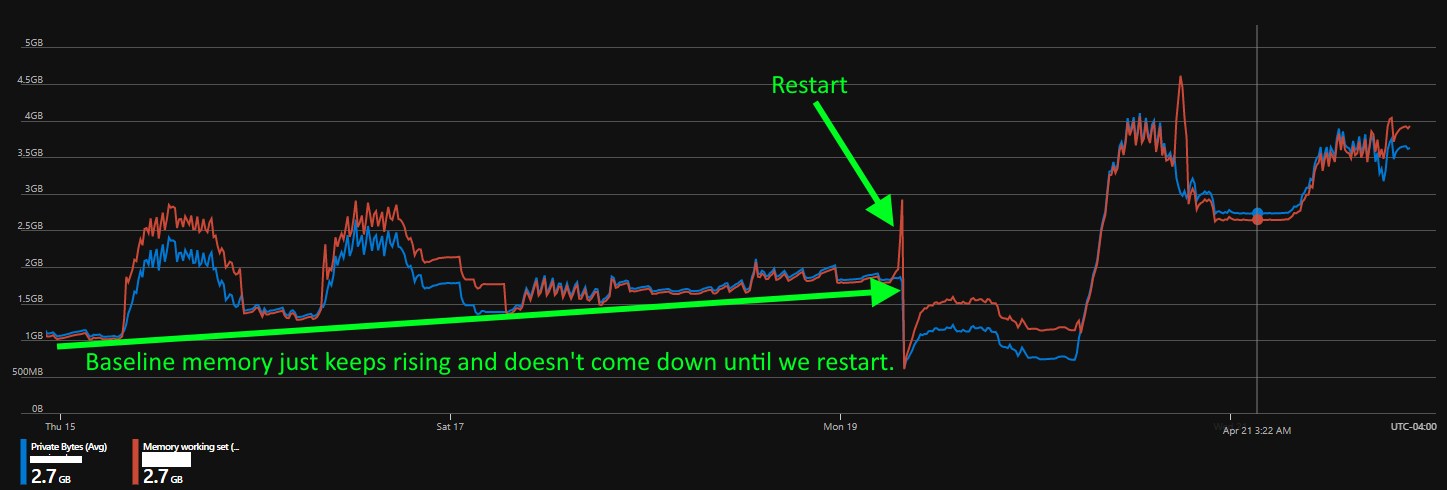
I notice that Signalr memory in IIS keeps increasing and never goes down even when the users are disconnected. Almost all the users (approx. 200 users) are connected using websockets.
Asp.net.SignalR.Client.dll - 2.2.3
Asp.net.SignalR.Core.dll - 2.2.3
Asp.net.SignalR.SystemWeb.dll - 2.2.3
Setup: Single server, dedicated app pool for Signalr WCF
O/S: Windows 2012 R2
Server : Ec2 T2XLarge ( 4 vCPU, 16 GB Mem)
Available Free memory : > 50%
Please refer to the IIS memory consumption taken for the application.
Regards,
Raja
20180730-1.xlsx
The text was updated successfully, but these errors were encountered: