Skip to content
New issue

Have a question about this project? Sign up for a free GitHub account to open an issue and contact its maintainers and the community.

By clicking “Sign up for GitHub”, you agree to our terms of service and privacy statement. We’ll occasionally send you account related emails.

Already on GitHub? Sign in to your account

Data leak using Ray Core and Ray Workflows #3

Closed
julietcohen opened this issue Oct 21, 2022 · 5 comments
Closed

Data leak using Ray Core and Ray Workflows #3

julietcohen opened this issue Oct 21, 2022 · 5 comments
Assignees
Labels
bug Something isn't working

Comments

@julietcohen
Copy link
Collaborator

julietcohen commented Oct 21, 2022

Data leak

While executing the PDG workflow with Ray, @KastanDay is consistently experiencing a data leak. The memory usage on NCSA's Delta server increases as the process runs, resulting in a crash. @robyngit suggested the issue might be in the rasterization step (vector -> raster).

Debugging approaches by Kastan and Robyn:

  1. Failed to get memory debugger to print within remote() function
  2. Run memory debugger on rasterize_vectors() without using ray
tr = tracker.SummaryTracker()
tr.print_diff()
print(':point_up: start of rasterize_vectors')

<run code here>

tr.print_diff()
print(':point_up: END of rasterize_vectors')
rasterizer = pdgraster.RasterTiler(config)
from pympler.classtracker import ClassTracker
tracker = ClassTracker()
tracker.track_object(rasterizer, resolution_level=2)
tracker.track_class(pdgraster.RasterTiler)
tracker.create_snapshot() # summary 1
# do the work 
rasterizer.rasterize_vectors(staged_paths, make_parents=False)
tracker.create_snapshot() # summary 2
# delete my class instance
del rasterizer
tracker.create_snapshot() # summary 3
tracker.stats.print_summary() 
  • result: no leak reported
  • tried resolution_level=3 (also tried 4, 5, 6)
  1. using a context manager with the geodataframes
@robyngit robyngit added the bug Something isn't working label Oct 24, 2022
@robyngit
Copy link
Member

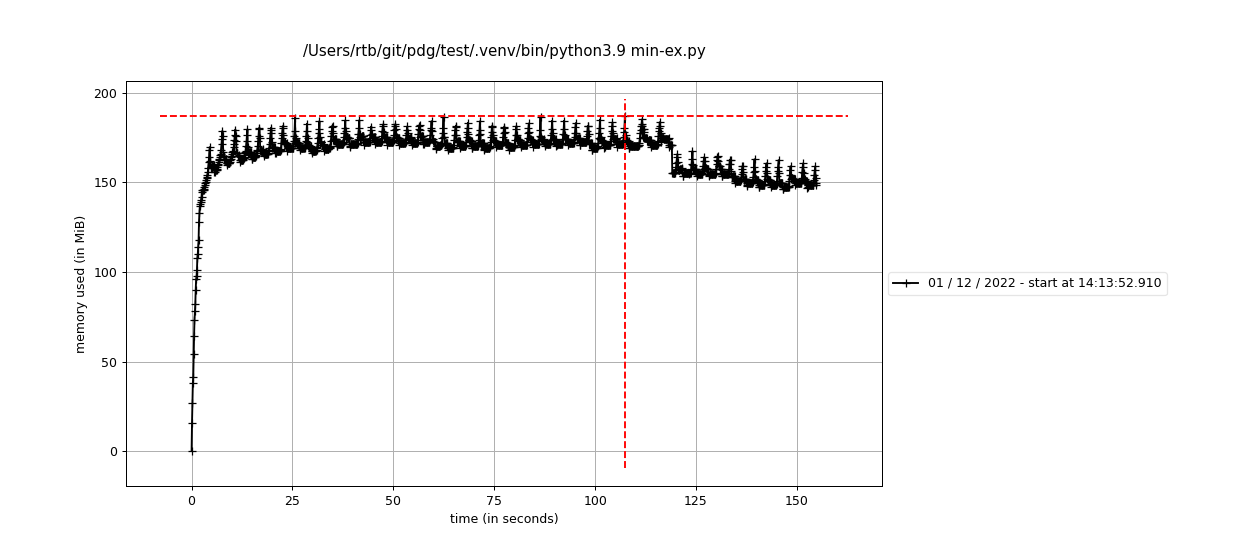
In the Raster class, in order to calculate pixel values based on the area of a pixel that a polygon covers, we use the geopandas overlay method to "slice" each polygon with the grid lines (see line 678-681).

I think that the overlay method could be producing a memory leak somehow. I made a minimal example where we create some row polygons, then create some column polygons, then overlay the two to create a grid. When we repeat this process many times, the memory usage starts to climb even though we are not storing the output (the grid GeoDataFrame) to any variable.

Here is the plot of memory usage over 200 runs:

overlay_memory_leak

This was created using the following python script:

from memory_profiler import profile
import geopandas as gpd
from shapely.geometry import box

# Number of rows & column polygons to make. Will results in n x n cells after
# overlay operation. The larger the number, the slower & more memory intensive
# the operation.
n = 100
# Number of times to repeat the same overlay process.
runs = 200

# Create n vertical rectangles (columns in a grid)
column_polygons = gpd.GeoDataFrame(
    geometry=[box(i, 0, i + 1, n) for i in range(n)])
# Create n horizontal rectangles (rows in a grid)
row_polygons = gpd.GeoDataFrame(
    geometry=[box(0, i, n, i + 1) for i in range(n)])


@profile
def suspected_leak():
    for i in range(0, runs):
        print(f'Run {i+1} of {runs}')
        # overlay the horizontal rectangles on the vertical rectangles,
        # resulting in n x n polygons (cells in a grid)
        column_polygons.overlay(row_polygons)


if __name__ == '__main__':
    suspected_leak()

To run the above code:

pip install memory-profiler geopandas
mprof run overlay_leak.py
mprof plot

Here is a plot from a slightly different version where we create a 500x500 grid (very slow) 10 times. The blue brackets indicate where the overlay operations start and stop:

overlay_leak_n500-runs10

I also tried tracking memory usage with pympler but I'm having a harder time interpreting the output.

For example, the following script ...

from pympler import tracker
import geopandas as gpd
from shapely.geometry import box


n = 200
runs = 5

column_polygons = gpd.GeoDataFrame(
    geometry=[box(i, 0, i + 1, n) for i in range(n)])
row_polygons = gpd.GeoDataFrame(
    geometry=[box(0, i, n, i + 1) for i in range(n)])


def suspected_leak():
    for i in range(0, runs):
        print(f'Run {i+1} of {runs}')
        column_polygons.overlay(row_polygons)


tr = tracker.SummaryTracker()
tr.print_diff()
print('\n👆 START of overlay operation\n\n')

suspected_leak()

tr.print_diff()
print('\n👆 END of overlay operation')

... gives the following output:

                                  types |   # objects |   total size
======================================= | =========== | ============
                                   list |        9650 |    829.05 KB
                                    str |        9650 |    694.05 KB
                                    int |        2487 |     68.01 KB
                                    set |          29 |      6.12 KB
                                weakref |          79 |      5.55 KB
             builtin_function_or_method |          48 |      3.38 KB
                                   dict |           6 |      1.22 KB
                      method_descriptor |          13 |    936     B
                                   type |           0 |    408     B
  pandas.core.arrays.numpy_.PandasArray |           2 |    144     B
                  function (store_info) |           1 |    136     B
  pandas.core.dtypes.dtypes.PandasDtype |           2 |     96     B
                     wrapper_descriptor |           1 |     72     B
                      member_descriptor |           1 |     64     B
                                 method |           1 |     64     B

👆 START of overlay operation


Run 1 of 5
Run 2 of 5
Run 3 of 5
Run 4 of 5
Run 5 of 5
                       types |   # objects |   total size
============================ | =========== | ============
                        code |           0 |      5.95 KB
               numpy.ndarray |           2 |      3.33 KB
                         str |          23 |      2.34 KB
                     StgDict |           2 |      1.16 KB
        _ctypes.PyCArrayType |           1 |      1.04 KB
      _ctypes.PyCPointerType |           1 |      1.04 KB
                       tuple |          10 |    664     B
                     weakref |           9 |    648     B
  builtin_function_or_method |           9 |    648     B
                        type |           0 |    496     B
                        list |           0 |    424     B
           getset_descriptor |           4 |    256     B
           weakcallableproxy |           1 |     72     B
                       bytes |           1 |     67     B
         _ctypes.DictRemover |           1 |     32     B

👆 END of overlay operation

The only potentially related issue I could find from geopandas is geopandas/geopandas#955, though this is about spatial joins (sjoin), not overlays

@robyngit robyngit self-assigned this Nov 2, 2022
@robyngit
Copy link
Member

robyngit commented Nov 2, 2022

Update!

TLDR

Installing the newest pygeos and upgrading shapely to match that version solves at least one memory leak in the workflow:

python -m pip install pygeos
python -m pip install --upgrade shapely

The long version

After a few dead ends (running malloc_trim after overlay operations, looking into alternative memory allocators like jemalloc, looking for memory leaks in pandas (on top of which GeoPandas is built), looking into using dask-geopandas instead of GeoPandas, etc.), I started piecing apart the code GeoPandas is using for the intersection overlay method. I tracked the source of the problem to this line. Commenting out this step completely flattened the memory profile plot when repeating overlay operations. The buffer(0) method in this line is used to correct invalid polygons created from intersections.

Turns out, that just calling buffer on a GeoSeries repeatedly was giving the same, ever increasing memory usage pattern.

Minimal example
from pympler import tracker
import geopandas as gpd
from shapely.geometry import box

tr = tracker.SummaryTracker()


def suspected_leak(n, runs):
    gdf = gpd.GeoDataFrame(
        geometry=[box(i, 0, i + 1, n) for i in range(n)])

    for i in range(0, runs):
        print(f'Run {i+1} of {runs}')
        gdf.geometry.buffer(0)


def main():
    n = 200
    runs = 20000

    print('\n👇 START of buffer operation\n\n')

    tr.print_diff()
    suspected_leak(n, runs)
    tr.print_diff()

    print('\n👆 END of buffer operation')


main()

Looking further into the buffer method revealed that GeoPandas uses different underlying methods depending on the availability of the Shapely vs. PyGEOS libraries. The preference is to use Shapely 2.0+ (in beta), then PyGEOS, then the older Shapely method. Looking at my pip freeze, I didn't have PyGEOS installed. Installing it (version 0.13) gave a warning about the incompatibility between my PyGEOS and Shapely versions, so I upgraded Shapely to the latest 1.8.5 version.

With these new library updates, repeating the overlay method stopped causing a memory leak. Overlay seems to be faster as well! The leak must originate in the older Shapely way that GeoPandas buffers geometries.

Apparently, PyGEOS and Shapely both call the C++ library GEOS, however, PyGEOS was considered the newer, faster method until December 2021, when the two libraries merged. Shapely 2.0 will eventually be released as the result of this merge.

Next steps

  • Test if this solves the memory leak: install PyGEOS, update Shapely, and re-run the rasterization step on Delta while monitoring the memory usage
  • Include PyGEOS 0.13+ & Shapely 1.8.5+ in setup.py

robyngit added a commit to PermafrostDiscoveryGateway/viz-staging that referenced this issue Nov 3, 2022
robyngit added a commit to PermafrostDiscoveryGateway/viz-raster that referenced this issue Nov 3, 2022
@robyngit
Copy link
Member

robyngit commented Nov 3, 2022

The memory leak mystery continues! I tested rasterizing 250,000 staged files on Delta, on a single node, using the ray workflow with the updated Shapely and pyGEOS libraries. With glances, I saw the memory usage start at around 10%, quickly climb when the workflow started, then steadily increase over about an hour to reach 100% and crash. At that point, I had gotten through rasterizing at least 198,400 of the staged tiles. Looks like no improvement from before the update! I'll keep looking into what part of the rasterization process is causing this leak.

robyngit added a commit to PermafrostDiscoveryGateway/viz-raster that referenced this issue Nov 29, 2022
@robyngit
Copy link
Member

I believe I found the source of the memory leak for real this time: I was opening a rasterio In-Memory file without closing it, every time a tile was rasterized... The issue seems obvious in retrospect... 🙃

This is fixed in PermafrostDiscoveryGateway/viz-raster@c56a8bc, but I'm going to do a larger run on delta before merging to be certain that this resolves the leak.

@robyngit
Copy link
Member

robyngit commented Dec 1, 2022

We are having trouble accessing delta resources, and unfortunately I could not get a run going on datateam that used anywhere near 100% memory usage. However, here is a little test that demonstrates why I believe that the issue we initially saw is fixed.

Given the following script run with mprof run test.py...

# test.py
from pdgraster import RasterTiler

def measure_memory(n):
    tiler = RasterTiler({})
    ex_path = 'staged/WorldCRS84Quad/13/1402/902.gpkg'
    for i in range(1, n):
        print(f'Job {i} of {n}')
        tiler.rasterize_vector(ex_path)

if __name__ == '__main__':
    measure_memory(50)

... Here is the memory profile plot using the main branch version of viz-raster:

main-50

... and here it is using the bug-mem-leak branch version of viz-raster with the new fix:

fix

I am going to merge the fix into main and consider this issue resolved, but we can re-open if needed.

@robyngit robyngit closed this as completed Dec 1, 2022
Sign up for free to join this conversation on GitHub. Already have an account? Sign in to comment
Labels
bug Something isn't working
Projects
None yet
Development

No branches or pull requests

2 participants