Machine learning researchers often evaluate their predictions directly on the whole test set. But, in fact, in real-world settings we have additional choices available, like asking for more information when we are uncertain. Because of the importance of accurate diagnosis, it would be unreasonable not to ask for further scans of the most ambiguous cases. Moreover, in this dataset, many images feature camera artefacts that distort results. In these cases, it is critically important that a model is able to tell when the information provided to it is not sufficiently reliable to classify the patient. Just like real medical professionals, any diagnostic algorithm should be able to flag cases that require more investigation by medical experts.
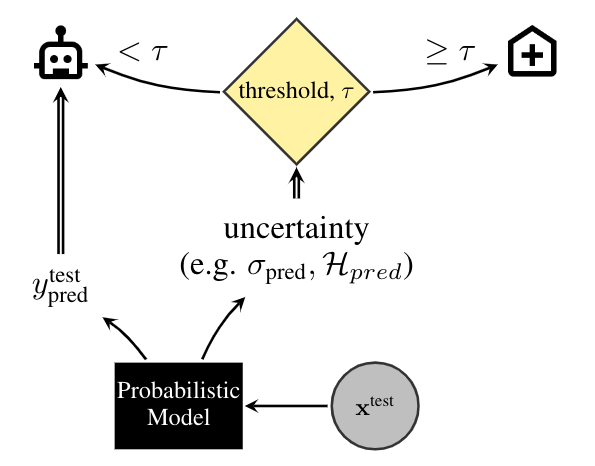
This task is illustrated in the figure above, where a threshold, τ, is used to flag cases as certain and uncertain, with uncertain cases referred to an expert. Alternatively, the uncertainty estimates could be used to come up with a priority list, which could be matched to the available resources of a hospital, rather than waste diagnostic resources on patients for whom the diagnosis is clear cut.
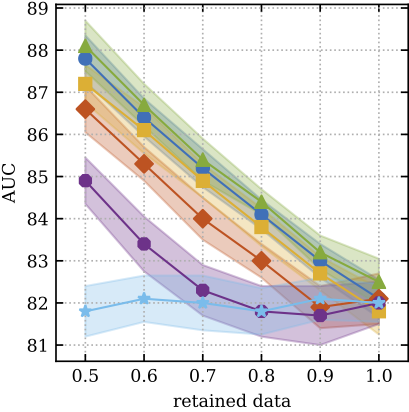
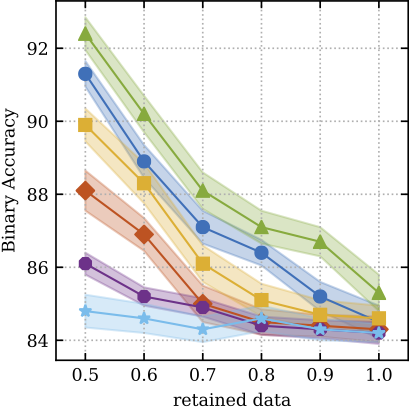
In order to simulate this process of referring the uncertain cases to experts and relying on the model's predictions for cases it is certain of, we assess the techniques by their diagnostic accuracy and area under receiver-operating-characteristic (ROC) curve, as a function of the referral rate. We expect the models with well-calibrated uncertainty to refer their least confident predictions to experts, improving their performance as the number of referrals increases.
The accuracy of the binary classifier is defined as the ratio of correctly classified data-points over the size of the population. The receiver-operating-characteristic (ROC) curve illustrates the diagnostic ability of a binary classifier system as its discrimination threshold is varied. It is created by plotting the true positive rate (a.k.a. sensitivity) against the false positive rate (a.k.a. 1 - sensitivity). The quality of such a ROC curve can be summarized by its area under the curve (AUC), which varies between 0.5 (chance level) and 1.0 (best possible value).

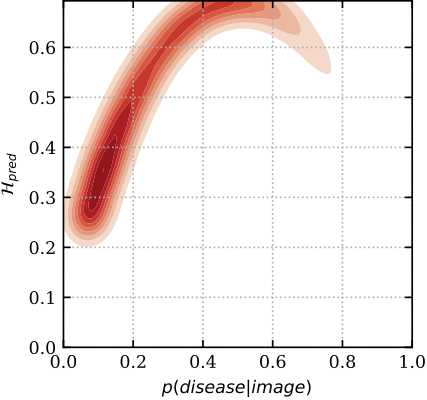
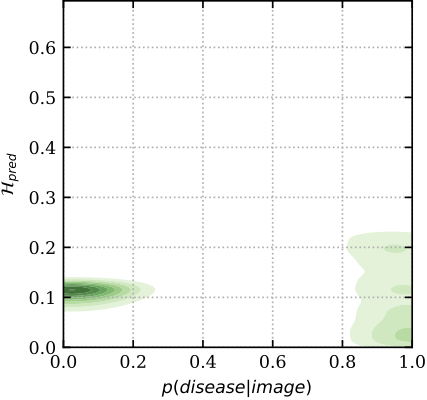
To get a better insight into the mechanics of these plots, below we show the relation between predictive uncertainty, e.g. entropy H_{pred} of MC Dropout (on y-axis), and maximum-likelihood, i.e. sigmoid probabilities p(disease| image) of a deterministic dropout model (on x-axis). In red are images classified incorrectly, and in green are images classified correctly. You can see that the model has higher uncertainty for the miss-classified images, whereas the softmax probabilities cannot distinguish red from green for low p (i.e. the plot is separable along the y-axis, but not the x-axis). Hence the uncertainty can be used as an indicator to drive referral.
The raw data is licensed and hosted by Kaggle, hence you will need a Kaggle account to fetch it. The Kaggle Credentials can be found at
https://www.kaggle.com/<username>/account -> "Create New API Key"
After creating an API key you will need to accept the dataset license.
Go to the dateset page on Kaggle and look
for the button I Understand and Accept (make sure when reloading the page that the button does not pop up again).
The Kaggle command line interface is used for downloading the data, which
assumes that the API token is stored at ~/.kaggle/kaggle.json. Run the following commands to populate it:
mkdir -p ~/.kaggle
echo '{"username":"${KAGGLE_USERNAME}","key":"${KAGGLE_KEY}"}' > ~/.kaggle/kaggle.json
chmod 600 ~/.kaggle/kaggle.json
Download and prepare the data by running:
python3 -u -c "from bdlb.diabetic_retinopathy_diagnosis.benchmark import DiabeticRetinopathyDiagnosisBecnhmark; DiabeticRetinopathyDiagnosisBecnhmark.download_and_prepare()"
Baseline we currently have implemented include:
- Deterministic
- Monte Carlo Dropout (following Gal and Ghahramani)
- Mean-Field Variational Inference (following Peterson and Anderson, Wen et al., 2018)
- Deep Ensembles (following Lakshminarayanan et al.)
- Ensemble MC Dropout (following Smith and Gal)
One executable script per baseline, main.py, is provided and can be used by running:
python3 baselines/diabetic_retinopathy_diagnosis/mc_dropout/main.py \
  --level=medium \
  --dropout_rate=0.2 \
  --output_dir=tmp/medium.mc_dropout
Or alternatively, use the baselines/*/configs for tuned hyperparameters per baseline:
python3 baselines/diabetic_retinopathy_diagnosis/mc_dropout/main.py --flagfile=baselines/diabetic_retinopathy_diagnosis/mc_dropout/configs/medium.cfg
The baseline results we evaluated on this benchmark are ranked below by AUC@50% data retained:
| Method | AUC (50% data retained) |
Accuracy (50% data retained) |
AUC (100% data retained) |
Accuracy (100% data retained) |
|---|---|---|---|---|
| Ensemble MC Dropout | 88.1 ± 1.2 | 92.4 ± 0.9 | 82.5 ± 1.1 | 85.3 ± 1.0 |
| MC Dropout | 87.8 ± 1.1 | 91.3 ± 0.7 | 82.1 ± 0.9 | 84.5 ± 0.9 |
| Deep Ensembles | 87.2 ± 0.9 | 89.9 ± 0.9 | 81.8 ± 1.1 | 84.6 ± 0.7 |
| Mean-field VI | 86.6 ± 1.1 | 88.1 ± 1.1 | 82.1 ± 1.2 | 84.3 ± 0.7 |
| Deterministic | 84.9 ± 1.1 | 86.1 ± 0.6 | 82.0 ± 1.0 | 84.2 ± 0.6 |
| Random | 81.8 ± 1.2 | 84.8 ± 0.9 | 82.0 ± 0.9 | 84.2 ± 0.5 |
A Systematic Comparison of Bayesian Deep Learning Robustness in Diabetic Retinopathy Tasks
Angelos Filos, Sebastian Farquhar, Aidan N. Gomez, Tim G. J. Rudner, Zachary Kenton, Lewis Smith, Milad Alizadeh, Arnoud de Kroon & Yarin Gal
Bayesian Deep Learning Workshop @ NeurIPS 2019 (BDL2019)
arXiv 1912.10481
@article{filos2019systematic,
  title={A Systematic Comparison of Bayesian Deep Learning Robustness in Diabetic Retinopathy Tasks},
  author={Filos, Angelos and Farquhar, Sebastian and Gomez, Aidan N and Rudner, Tim GJ and Kenton, Zachary and Smith, Lewis and Alizadeh, Milad and de Kroon, Arnoud and Gal, Yarin},
  journal={arXiv preprint arXiv:1912.10481},
  year={2019}
}
Please cite individual baselines you compare to as well: