
/'taŋg(ə)l/
noun
Tangle is a Clojure library to visualize your tangle of data with Graphviz.
Add to your project.clj:

Here's some example usage:
(ns examples.hello
(:use [tangle.core]
[clojure.java.io]))
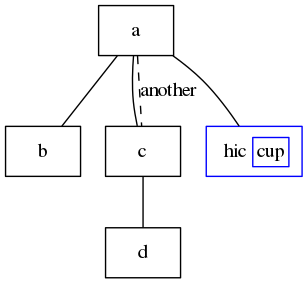
(def html-node {:id "html" :color "blue" :label [:TABLE {:BORDER 0} [:TR [:TD "hic"] [:TD {:BORDER 1} "cup"]]]})
(def nodes [:a :b :c :d html-node])
(def edges [[:a :b] [:a :c] [:c :d] [:a :c {:label "another" :style :dashed}] [:a :html]])
(def dot (graph->dot nodes edges {:node {:shape :box}
:node->id (fn [n] (if (keyword? n) (name n) (:id n)))
:node->descriptor (fn [n] (when-not (keyword? n) n))
}))
(copy (dot->image dot "png") (file "examples/hello.png"))This is what you will get:
And the corresponding DOT:
graph {

graph[dpi=100, rankdir=TP]
node[shape=box]
"a"
"b"
"c"
"d"
"html"[id="html", color="blue", label=<<TABLE BORDER="0"><TR><TD>hic</TD><TD BORDER="1">cup</TD></TR></TABLE>>]

"a" -- "b"
"a" -- "c"
"c" -- "d"
"a" -- "c"[label="another", style=dashed]
"a" -- "html"
}
You can save an SVG file like this. dot->svg discards the incorrect viewport, which the dot->image doesn't do.
(copy (dot->svg dot) (file "examples/hello.svg"))It's possible to make record nodes if you use vectors for the label. See the html-node from the example. Hiccup-like labels (vector + keyword as first) are transformed into HTML-like labels. This support may be improved in the future.
Now if you have Rhizome (or other use for the BufferedImage)!
(def i (dot->image dot "png"))
(use 'rhizome.viz)
(view-image (javax.imageio.ImageIO/read i))
You may also be interested in archi for a use of tangle, as well as drawing architecture diagrams.
Through the years I have used Graphviz for many projects. I prefer to draw diagrams by programming and use it for layout. Despite its limitations, I have used it successfully and delivered many a graph.
To use Graphviz in Clojure, you may consider Dorothy and Rhizome. I find Dorothy a little bit too simple, you basically need a DSL on top of it. Rhizome does that but doesn't support multiple edges between same nodes conveniently. Hence I have decided to write my own. Thank you to both authors for inspiration!
Tangle is quite compatible with Rhizome, if you decide you want to pop up Swing frames with images.
Copyright © 2014-2020 Markku Rontu
Distributed under the Eclipse Public License, the same as Clojure.