NEWS: RobMOTS Challenge for the RVSU CVPR'21 Workshop is now live!!!! Challenge deadline June 15.
NEWS: Call for short papers (4 pages) on tracking and other video topics for RVSU CVPR'21 Workshop!!!! Paper deadline June 4.
TrackEval is now the Official Evaluation Kit for the RobMOTS Challenge.
This repository contains the official evaluation code for the challenges available at the RobMOTS Website.
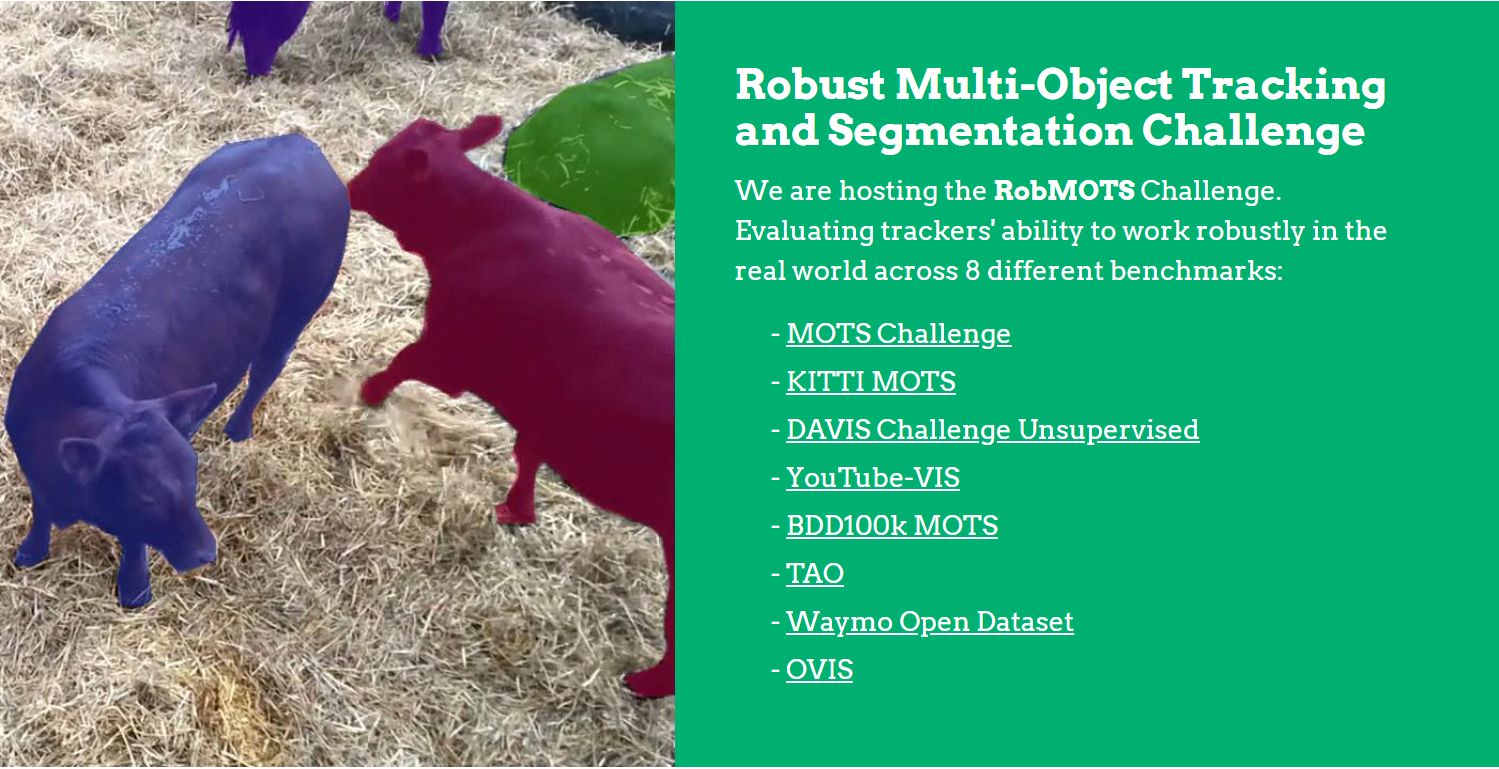
The RobMOTS Challenge tests trackers' ability to work robustly across 8 different benchmarks, while tracking the 80 categories of objects from COCO.
The following benchmarks are included:
| Benchmark | Website |
|---|---|
| MOTS Challenge | https://motchallenge.net/results/MOTS/ |
| KITTI-MOTS | http://www.cvlibs.net/datasets/kitti/eval_mots.php |
| DAVIS Challenge Unsupervised | https://davischallenge.org/challenge2020/unsupervised.html |
| YouTube-VIS | https://youtube-vos.org/dataset/vis/ |
| BDD100k MOTS | https://bdd-data.berkeley.edu/ |
| TAO | https://taodataset.org/ |
| Waymo Open Dataset | https://waymo.com/open/ |
| OVIS | http://songbai.site/ovis/ |
Simply follow the code snippet below to install the evaluation code, download the train groundtruth data and an example tracker, and run the evaluation code on the sample tracker.
Note the code requires python 3.5 or higher.
# Download the TrackEval repo
git clone https://github.com/JonathonLuiten/TrackEval.git

# Move to repo folder
cd TrackEval

# Create a virtual env in the repo for evaluation
python3 -m venv ./venv

# Activate the virtual env
source venv/bin/activate

# Update pip to have the latest version of packages
pip install --upgrade pip

# Install the required packages
pip install -r requirements.txt

# Download the train gt data
wget https://omnomnom.vision.rwth-aachen.de/data/RobMOTS/train_gt.zip

# Unzip the train gt data you just downloaded.
unzip train_gt.zip

# Download the example tracker
wget https://omnomnom.vision.rwth-aachen.de/data/RobMOTS/example_tracker.zip

# Unzip the example tracker you just downloaded.
unzip example_tracker.zip

# Run the evaluation on the provided example tracker on the train split (using 4 cores in parallel)
python scripts/run_rob_mots.py --ROBMOTS_SPLIT train --TRACKERS_TO_EVAL STP --USE_PARALLEL True --NUM_PARALLEL_CORES 4
You may further download the raw sequence images and supplied detections (as well as train GT data and example tracker) by following the Data Download link here:
You will find the results of the evaluation (for the supplied tracker STP) in the folder TrackEval/data/trackers/rob_mots/train/STP/.
The overall summary of the results is in ./final_results.csv, and more detailed results per sequence and per class and results plots can be found under ./results/*.
The final_results.csv can be most easily read by opening it in Excel or similar. The c, d and f prepending the metric names refer respectively to class averaged, detection averaged (class agnostic) and final (the geometric mean of class and detection averaged).
To make creating your own tracker particularly easy, we supply a set of strong supplied detection.
These detections are from the Detectron 2 Mask R-CNN X152 (very bottom model on this page which achieves a COCO detection mAP score of 50.2).
We then obtain segmentation masks for these detections using the Box2Seg Network (also called Refinement Net), which results in far more accurate masks than the default Mask R-CNN masks. The code for this can be found here.
We supply two different supplied detections. The first is the raw_supplied detections, which is taking all 1000 detections output from the Mask R-CNN, and only removing those for which the maximum class score is less than 0.02 (here no non-maximum suppression, NMS, is run). These can be downloaded here.
The second is non_overlap_supplied detections. These are the same detections as above, but with further processing steps applied to them. First we perform Non-Maximum Suppression (NMS) with a threshold of 0.5 to remove any masks which have an IoU of 0.5 or more with any other mask that has a higher score. Second we run a Non-Overlap algorithm which forces all of the masks for a single image to be non-overlapping. It does this by putting all the masks 'on top of' each other, ordered by score, such that masks with a lower score will be partially removed if a mask with a higher score partially overlaps them. Note that these detections are still only thresholded at a score of 0.02, in general we recommend further thresholding with a higher value to get a good balance of precision and recall.
Code for this NMS and Non-Overlap algorithm can be found here: Non-Overlap Code.
Note that for RobMOTS evaluation the final tracking results need to be 'non-overlapping' so we recommend using the non_overlap_supplied detections, however you may use the raw_supplied, or your own or any other detections as you like.
Supplied detections (both raw and non-overlapping) are available for the train, val and test sets.
Example code for reading in these detections and using them can be found here:
We provide sample code (Tracker Example) for our STP tracker (Simplest Tracker Possible) which walks though how to create tracking results in the required RobMOTS format.
This includes code for reading in the supplied detections and writing out the tracking results in the desired format, plus many other useful functions (IoU calculation etc).
To evaluate your tracker, put the results in the folder TrackEval/data/trackers/rob_mots/train/, in a folder alongside the supplied tracker STP with the folder labelled as your tracker name, e.g. YOUR_TRACKER.
You can then run the evaluation code on your tracker like this:
python scripts/run_rob_mots.py --ROBMOTS_SPLIT train --TRACKERS_TO_EVAL YOUR_TRACKER --USE_PARALLEL True --NUM_PARALLEL_CORES 4
For RobMOTS, trackers must submit their results in the following folder format:
|—— <Benchmark01>
  |—— <Benchmark01SeqName01>.txt
  |—— <Benchmark01SeqName02>.txt
  |—— <Benchmark01SeqName03>.txt
|—— <Benchmark02>
  |—— <Benchmark02SeqName01>.txt
  |—— <Benchmark02SeqName02>.txt
  |—— <Benchmark02SeqName03>.txt
See the supplied STP tracker results (in the Train Data linked above) for an example.
Thus there is one .txt file for each sequence. This file has one row per detection (object mask in one frame). Each row must have 7 values and has the following format:
<Timestep>(int),
<Track ID>(int),
<Class Number>(int),
<Detection Confidence>(float),
<Image Height>(int),
<Image Width>(int),
<Compressed RLE Mask>(string),
Timesteps are the same as the frame names for the supplied images. These start at 0.
Track IDs must be unique across all classes within a frame. They can be non-unique across different sequences.
The mapping of class numbers to class names can be found is this file. Note that this is the same as used in Detectron 2, and is the default COCO class ordering with the unused numbers removed.
Detection Confidence score should be between 0 and 1. This is not used for HOTA evaluation, but is used for other eval metrics like Track mAP.
Image height and width are needed to decode the compressed RLE mask representation.
The Compressed RLE Mask is the same format used by coco, pycocotools and mots.
An example of a tracker result file looks like this:
0 1 3 0.9917707443237305 1200 1920 VaTi0b0lT17F8K3M3N1O1N2O0O2M3N2N101O1O1O01O1O0100O100O01O1O100O10O1000O1000000000000000O1000001O0000000000000000O101O00000000000001O0000010O0110O0O100O1O2N1O2N0O2O2M3M2N2O1O2N5J;DgePZ1
0 2 3 0.989478349685669 1200 1920 Ql^c05ZU12O2N001O0O10OTkNIaT17^kNKaT15^kNLbT14^kNMaT13^kNOaT11_kN0`T10_kN1`T11_kN0`T11_kN0`T1a0O00001O1O1O3M;E5K3M2N000000000O100000000000000000001O00001O2N1O1O1O000001O001O0O2O0O2M3M3M3N2O1O1O1N2O002N1O2N10O02N10000O1O101M3N2N2M7H^_g_1
1 2 3 0.964085042476654 1200 1920 o_Uc03\U12O1O1N102N002N001O1O000O2O1O00002N6J1O001O2N1O3L3N2N4L5K2N1O000000000000001O1O2N01O01O010O01N2O0O2O1M4L3N2N101N2O001O1O100O0100000O1O1O1O2N6I4Mdm^`1
Note that for the evaluation to be valid, the masks must not overlap within one frame.
The supplied detections have the same format (but with all the Track IDs being set to 0).
The groundtruth data for most benchmarks is in the exact same format as above (usually Detection Confidence is set to 1.0). The exception is the few benchmarks for which the ground-truth is not segmentation masks but bounding boxes (Waymo and TAO). For these the last three columns are not there (height, width and mask) as these encode a mask, and instead there are 4 columns encoding the bounding box co-ordinates in the format x0 y0 x1 y1, where x0 and y0 are the coordinates of the top left of the box and x1 and y0 are the coordinates for the bottom right.
The groundtruth can also contain ignore regions. The are marked by being having a class number of 100 or larger. Class number 100 encodes and ignore region for all class, which class numbers higher than 100 encode ignore regions specific to each class. E.g. class number 105 are ignore regions for class 5.
As well as the per sequence files described above, the groundtruth for each benchmark contains two more files clsmap.txt and seqmap.txt.
clsmap.txt is a single row, space-separated, containing all of the valid classes that should be evaluated for each benchmark (not all benchmarks evaluate all of the coco classes).
seqmap.txt contains a list of the sequences to be evaluated for that benchmark. Each row has at least 4 values. These are:
<sequence name> <number of frames in sequence> <sequence image height> <sequence image width>
More than 4 values can be present, the remaining values are 'ignore classes for this sequence'. E.g. classes which are evaluated for the particular benchmark as a whole, but should be ignored for this sequence.
We provide code for converting our .txt format with compressed RLE masks into .png format where it is easy to visualize the GT and Predicted masks.
This code can be found here:
The val and test GT will NOT be provided. However we provide a live evaluation server to upload your tracking results and evaluate it on the val and test set.
The val server will allow infinite uploads, while the test will limit trackers to 4 uploads total.
These evaluation servers can be found here: https://eval.vision.rwth-aachen.de/vision/
Ensure that your files to upload are in the correct format. Examples of the correct way to upload files can be found here: STP val upload, STP test upload.
If you work with the code and the benchmark, please cite:
TrackEval
@misc{luiten2020trackeval,
  author =       {Jonathon Luiten, Arne Hoffhues},
  title =        {TrackEval},
  howpublished = {\url{https://github.com/JonathonLuiten/TrackEval}},
  year =         {2020}
}
HOTA metrics
@article{luiten2020IJCV,
  title={HOTA: A Higher Order Metric for Evaluating Multi-Object Tracking},
  author={Luiten, Jonathon and Osep, Aljosa and Dendorfer, Patrick and Torr, Philip and Geiger, Andreas and Leal-Taix{\'e}, Laura and Leibe, Bastian},
  journal={International Journal of Computer Vision},
  pages={1--31},
  year={2020},
  publisher={Springer}
}
We are constantly working on improving RobMOTS, and wish to provide the most useful support to the community. You can help us to make the benchmark better by open issues in the repo and reporting bugs.
For general questions, please contact the following:
Jonathon Luiten - luiten@vision.rwth-aachen.de