Problem running Demo_benchmark_model.py #42
Comments
There was a problem because ground truth dataset names were changed at some point (revision of the Cascade paper), resulting in mismatched references for models that were trained prior to this time point.
|
Hi @Mariofe25, Thanks for reporting these bugs. I think you're not doing something wrong, there were indeed some bugs in the script. For my own purposes, I was using a pretty modified version of the script in a branch of the repository, so I did not notice that there were indeed bugs.
About the amount of temporal smoothing (50ms vs. 100ms): This depends a lot on your data and what you want to do with them. I recently found out that some users would like to have a temporally more precise (and, due to the trade-off, more noisy) predictions, and I will soon add models trained e.g. with 30 Hz and smoothing of 25 ms. It seems that one really has to inspect the predictions and check how they look like. For a noise level of 3-4, smoothing of 50 ms feels appropriate to me; but one but as well try what the 100 ms model and the 25 ms model (to be uploaded during the next days) will give. |
|
Coming back to the second issue:
|
Fix bug 1 from issue #42, now correctly
|
I tested the script with a noise level = 4 setting, and it went through smoothly. I hope this solves the issue for you as well, and I will close this issue now. If the issue still persists on your side or if you want to discuss the results that you get with the script, please feel free to re-open the issue - I'd be happy to help if I can! And thanks a lot for bringing up this bug! |
|
Thanks for your quick reply and fixes! I'll run it again later today |
|
Hi Peter! |

|
Hi Mariofe! I'll run the benchmark with your settings (Gaussian smoothing 50 ms; sampling rate 30 Hz; noise level 4; global model; ensemble_size 5) and will come back with results in a few days. The fact that correlation increases with more smoothing (100 ms instead of 50 ms) is not surprising (see Extended Figure 9c, although this analysis is not quantitatively comparable since it uses slightly different parameters). The increased correlation with more smoothing, however, does not have to mean that more smoothing is always better, because also the criteria become simply stricter. Without knowing too much, I would stick with the 50 ms model, although your choice might differ depending on the questions that you want to address. I agree, the jRCaMP1a data are not enough to train a reliable model, unfortunately. So I would stick with the global model. In general, in order to predict the performance of a model on e.g. jRCaMP1a noise level 4 data, I would not look at the "jRCaMP1a ground truth dataset correlation" but rather at the "general correlation". As a test set, the jRCaMP1a data are again too few and not reliable enough. I'll come back to you once I get the results from the benchmarking. I'm running it on a slow computer, so it might take a while ;-) |
|
Hi @Mariofe25, After running the network, I got an overall performance of 67% (similar to your 65%). Unfortunately, a Windows update restarted the computer before I could thoroughly check the results, so I do not remember the result for the jRCaMP1a dataset specifically. However, I will run it again and report the result so you can compare directly and also get an idea about variability. This said, I'm not quite sure that your results are overall correct, and I would go with an expected performance for your new jRCaMP1a data of ca. 65 +- m.a.d. %. A remaining question from my perspective is why you were doubtful about this result. Maybe you can say more about this. Maybe you compared the performance to the Cascade paper Figure 3a+b, where one gets performances of >80%, which is higher than your 65%. The differences of the paper's result compared to your analysis are more temporal smoothing (200 ms instead of 50 ms) and lower sampling rate (7.5 Hz instead of 30 Hz). The first effect (smoothing) is clear, as discussed above. For the second effect (sampling rates), one needs to understand that performance metrics based on lower sampling rates basically use averaging across time and therefore yield automatically higher values for correlation (without giving better predictions). The two effects together are responsible for the differences. Maybe this also shows that we do not have a perfect intuitive understanding of performance measures like correlation. Correlation of 65% at 30 Hz is better than 65% with the same settings at 7.5 Hz. |
|
Hi Peter, |
|
Hi again @Mariofe25, I would not recommend smoothing of calcium traces before predictions - the deep network takes advantage of all the information available, and smoothing would discard some of this information. There is some indication that the jRCaMP1a dataset simply included more noise (movement artifacts, baseline drift, etc.) than other datasets (explaining the moderate correlation value for this dataset) but that jRCaMP1a is not really different from the other indicators. If you look again at Figure 3a, one can notice that the values for row no. 20 are relatively high whereas the values for column no. 20 are much lower. This indicates that the indicator properties for e.g. GCaMP6 and jRCaMP1a are similar (indicated by the row) but that recording conditions for this specific dataset no. 20 were not so great. And yes, of course, feel free to upload some example calcium traces, and I will let you know what I think about them and their predictions! The results from my re-analysis will come in tomorrow - I'm also running the script on a simple slow CPU because I did not want to dedicate a GPU for this small task. |
|
Hi @Mariofe25, here are the results. They seem to be overall consistent with yours (median correlation 0.67, correlation for jRCaMP1a dataset 0.47). There are some differences due to the variability and randomness of initial conditions when training a deep network. So I guess that your training procedure, despite being interrupted a few times, ran correctly. Benchmark_50ms_30Hz_noise4.csv Let me know if you have any other questions! |
|
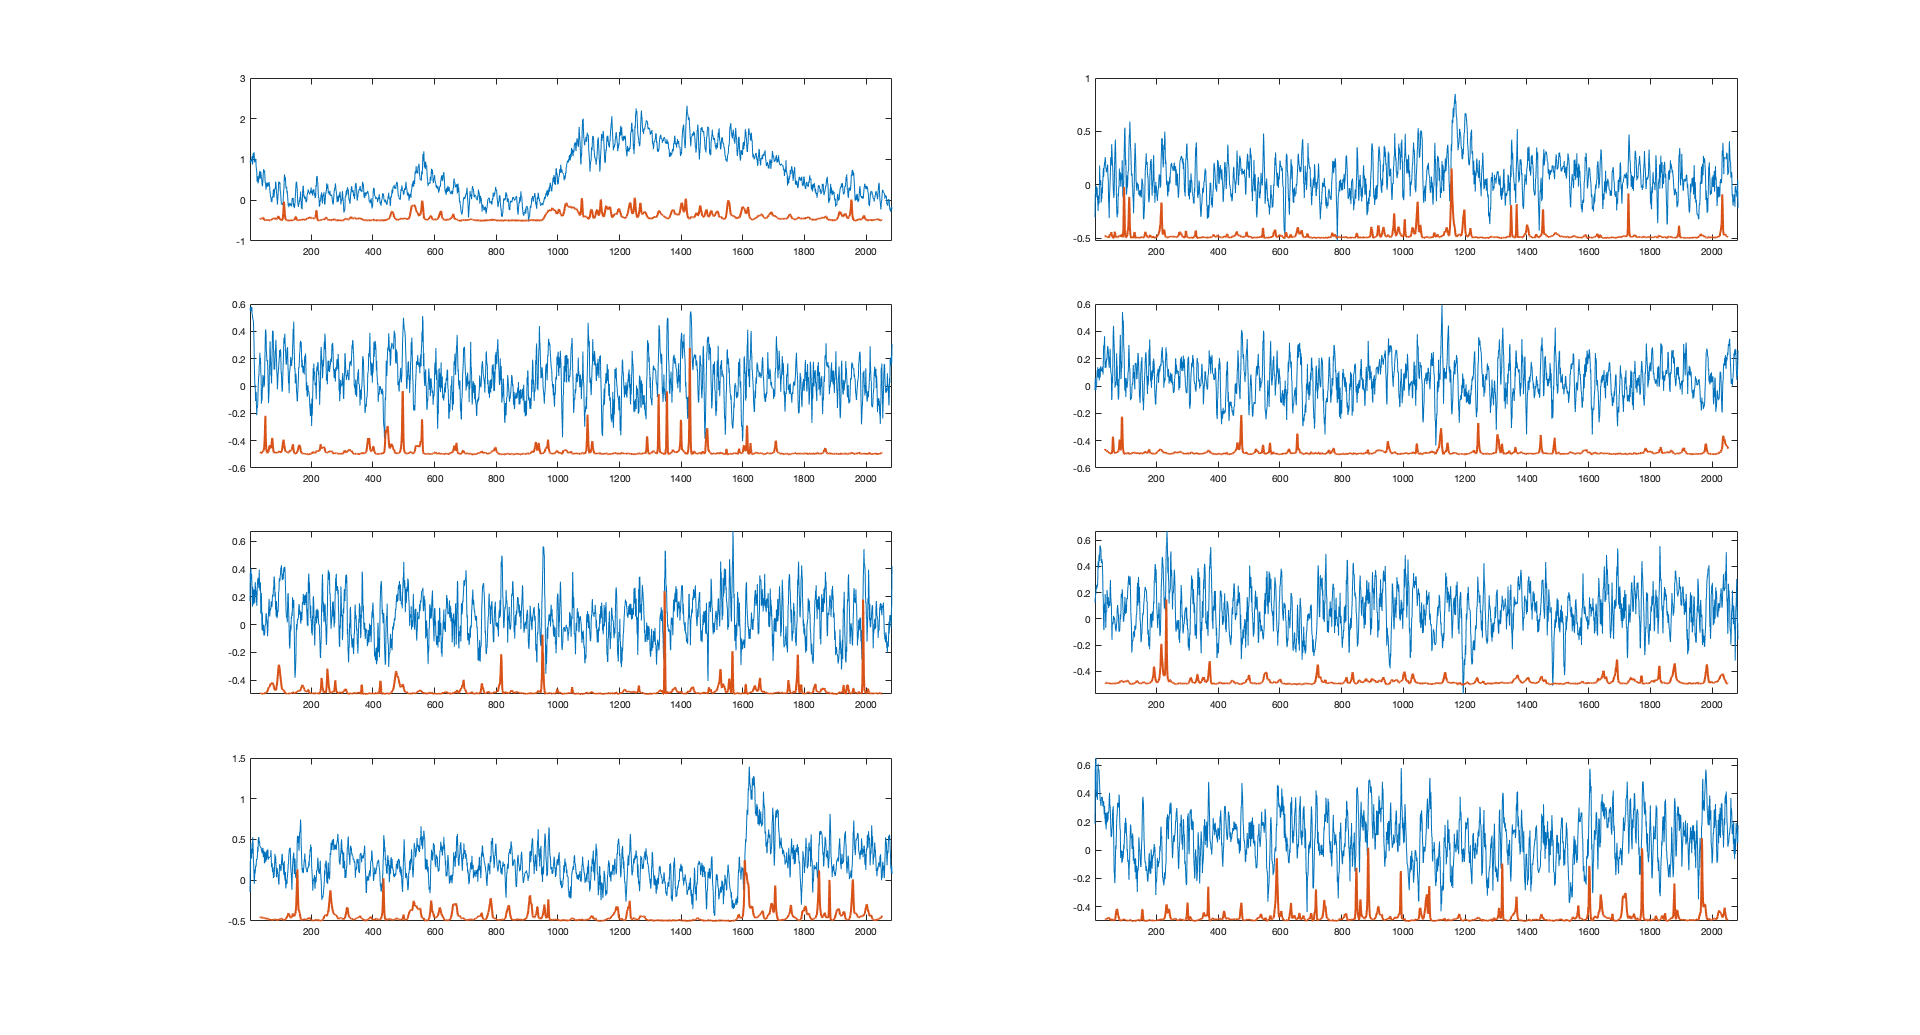
Alright! thanks. Here are some example traces randomly taken from my dataset. What do you think? |
|
Hi @Mariofe25, Thanks for sharing. I'm not 100% sure, and you should check it yourself, but I think there is a problem with the raw data. There seems to be a prominent noise source, with an oscillatory pattern of approximately 0.3-0.5 Hz. It could be biologically generated signals, but it seems too regular and too oscillatory. Such a pattern may arise from beating patterns from the frequencies of your power line (50 Hz or 60 Hz) and your imaging rate (30 Hz); or it could arise from similar effects due to the preamplifier power supply; or due to laser instabilities which makes the output power oscillate from pulse to pulse; and, unfortunately, many other less likely causes are possible. I assume, if you look at the raw movie data, there will be some sort of bright stripes traveling through the field of view, and when you draw an ROI, the ROI's extracted fluorescence will be modulated by these stripes and show up as a periodic pattern. This sort of noise is not shot noise and is therefore not taken into account by the "noise level" as computed in the paper (which takes into account only subsequent samples, in order to identify shot noise). The network therefore assumes that there is little noise, while in reality there are many artifacts from these oscillatory patterns, and these artifacts are then often falsely detected as true neuronal activity.
Of course, all of this is just a guess based on the traces I saw. Maybe you can have a deeper look into your data and let me know what happened in reality. |
|
Hi Peter, |
|
Hi @Mariofe25, I think the higher power in the 0.1-0.5 Hz band is unlikely to be neuronal activity. I have not seen activity patterns like this before. In particular, the rising and decaying phase look symmetrical, which is very atypical for calcium indicators. Maybe you could try to do some sort of signal de-contamination from the raw movie traces. For example, if you see that there is a propagating brightness modulation in the movie, then you can remove it by drawing a "neuropil" region (e.g., a ring of 5-10 pixels around the neuronal ROI) around the neuron of interest. From the neuropil trace, you could bandpass-extract e.g. the 0.1-0.5 component (it must be a bandpass, in order not to remove the DC component) and linearly regress away this component from the neuronal fluorescence trace. This is of course a procedure where you have to go back to the raw data, but - depending on how the noise band shows up in the movie - this could restore the data nicely. The open question to me is whether the small events (reaching dF/F of 0.3-0.5) are noise, or real calcium events that are only barely detectable. Testing the neuropil/noise-decontamination on a few neurons could shed light on this question. Once you know a clear answer to this question, you could tune your analysis pipeline (e.g., the noise level of the Cascade model; or another setting of your analysis) to detect or not detect these smaller events. Good luck with all these analyses! It's for sure a bit frustrating to have to deal with sub-optimal data, but in hindsight we always know better (and similar things have happened to me as well, multiple times ...). |
Hi! I have used the toolbox to predict the spike probability of my 2P recordings (jRCaMP1a, 30Hz). On average the noise levels are around 3-4, so I decided to use the 'Global_EXC_30Hz_smoothing50ms_causalkernel' (maybe the 100ms smoothing would be better?). Since the data is kind of noisy I decided to not get the discrete spikes, as suggested.
When I tried to quantify the expected performance of the model using the demo script, I encountered some problems (or maybe I'm doing something wrong)
I only modified the model to 'Global_EXC_30Hz_smoothing50ms_causalkernel' and set the noise level to 4 in the script.
Thanks in advance
The text was updated successfully, but these errors were encountered: