Numerical differentiation and noise filtering #6
Comments
|
To get the cutoff frequency, I first calculate the PSD of each signal using Welch's method (calculates periodogram, robust against noise but lower frequency resolution). Then I calculate the mean log value of PSD for each signal and multiply it by some number smaller than 1 ( 0.8 in this case). This mean is visualized in the plots as a horizontal dotted line, it's supposed to be above the higher frequency PSD values. The base cutoff frequency is calculated as the highest frequency where the log-mean and the PSD intersects. This base cutoff frequency is then multiplied by some number ( 1.7 in this case), to increase the bandwidth, since the base cutoff results in bad signal reconstruction when the signal's transformed back into time domain. The new cutoff frequency is then used in the filtering phase. Finding cutoff frequencies: Magnitudes of the Fourier coefficients (sqrt of PSD?), kept frequencies are green: State signals after iFFT: Zoomed: Signal reconstruction is pretty good, the noise in this example is pretty heavy, especially for some signals. |


|
Filtering a signal with 3x weaker noise, zoomed: |

Numerical differentiation decreases the Signal/Noise Ratio (SNR), and the measured data (position of the cart and the angle of the endulum) must be differentiated twice (to obtain velocity and acceleration). This means there's a need for robust pre-processing filtering step. Normal kernel-based filters probably aren't good enough and I'd like to use FFT, so I'll do part of the filtering by cutting off higher frequencies. The cutoff frequency will be based off of the PSD of each signal. Coincidentally, I found a paper ( https://arxiv.org/abs/2009.01911 ) again from UW, which finds the cutoff frequency similarly and has the same co-author (prof. Kutz) as the SINDy paper.
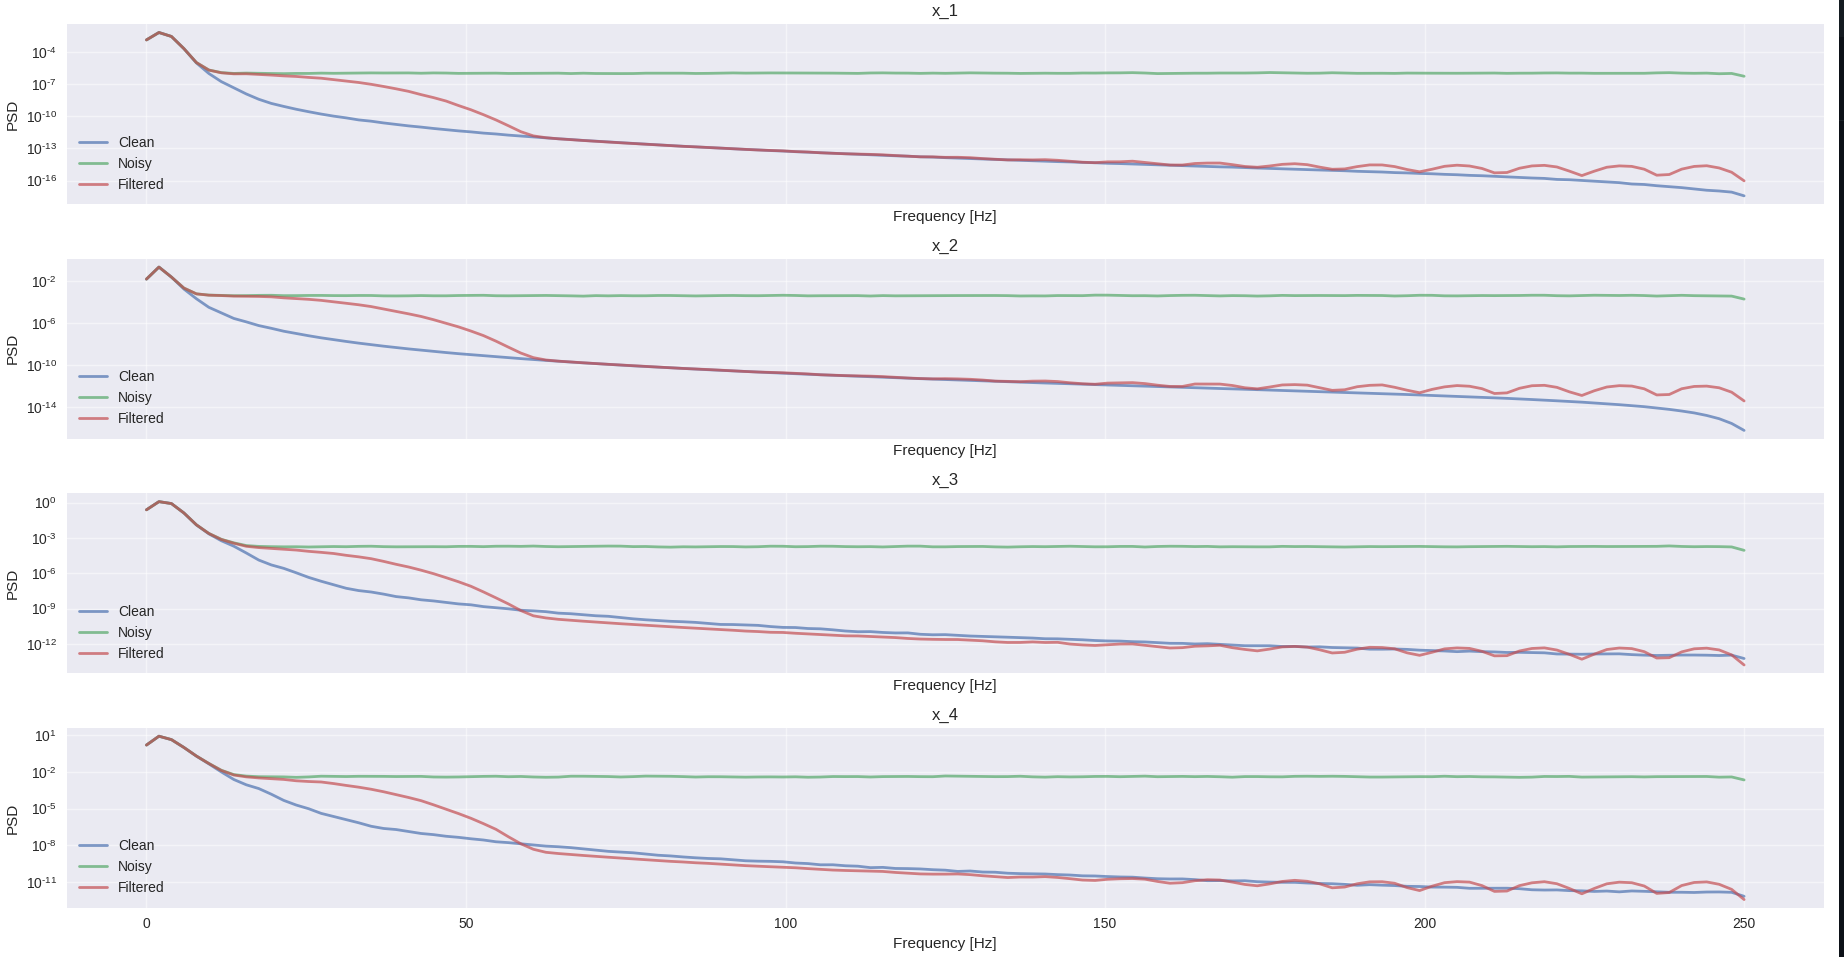
PSD of the state signals, the 'Filtered' signal is filtered with a non-causal flattop kernel with the size 60. Real measurements will contain only measurements x1 and x2, x3 and x4 must be gotten through differentiating them.
The text was updated successfully, but these errors were encountered: