Abnormally Low Downloads #750
Comments
|
Hi. Thanks for flagging this! It is definitely strange behavior. I don't think we changed anything in August that would cause this, so I have a hunch it may be an issue with sampling in GA. Regardless, we'll take a look! Can you tell me which agencies you were tracking so we can look at them specifically? |
|
Thanks for the quick response. We are just using the |
|
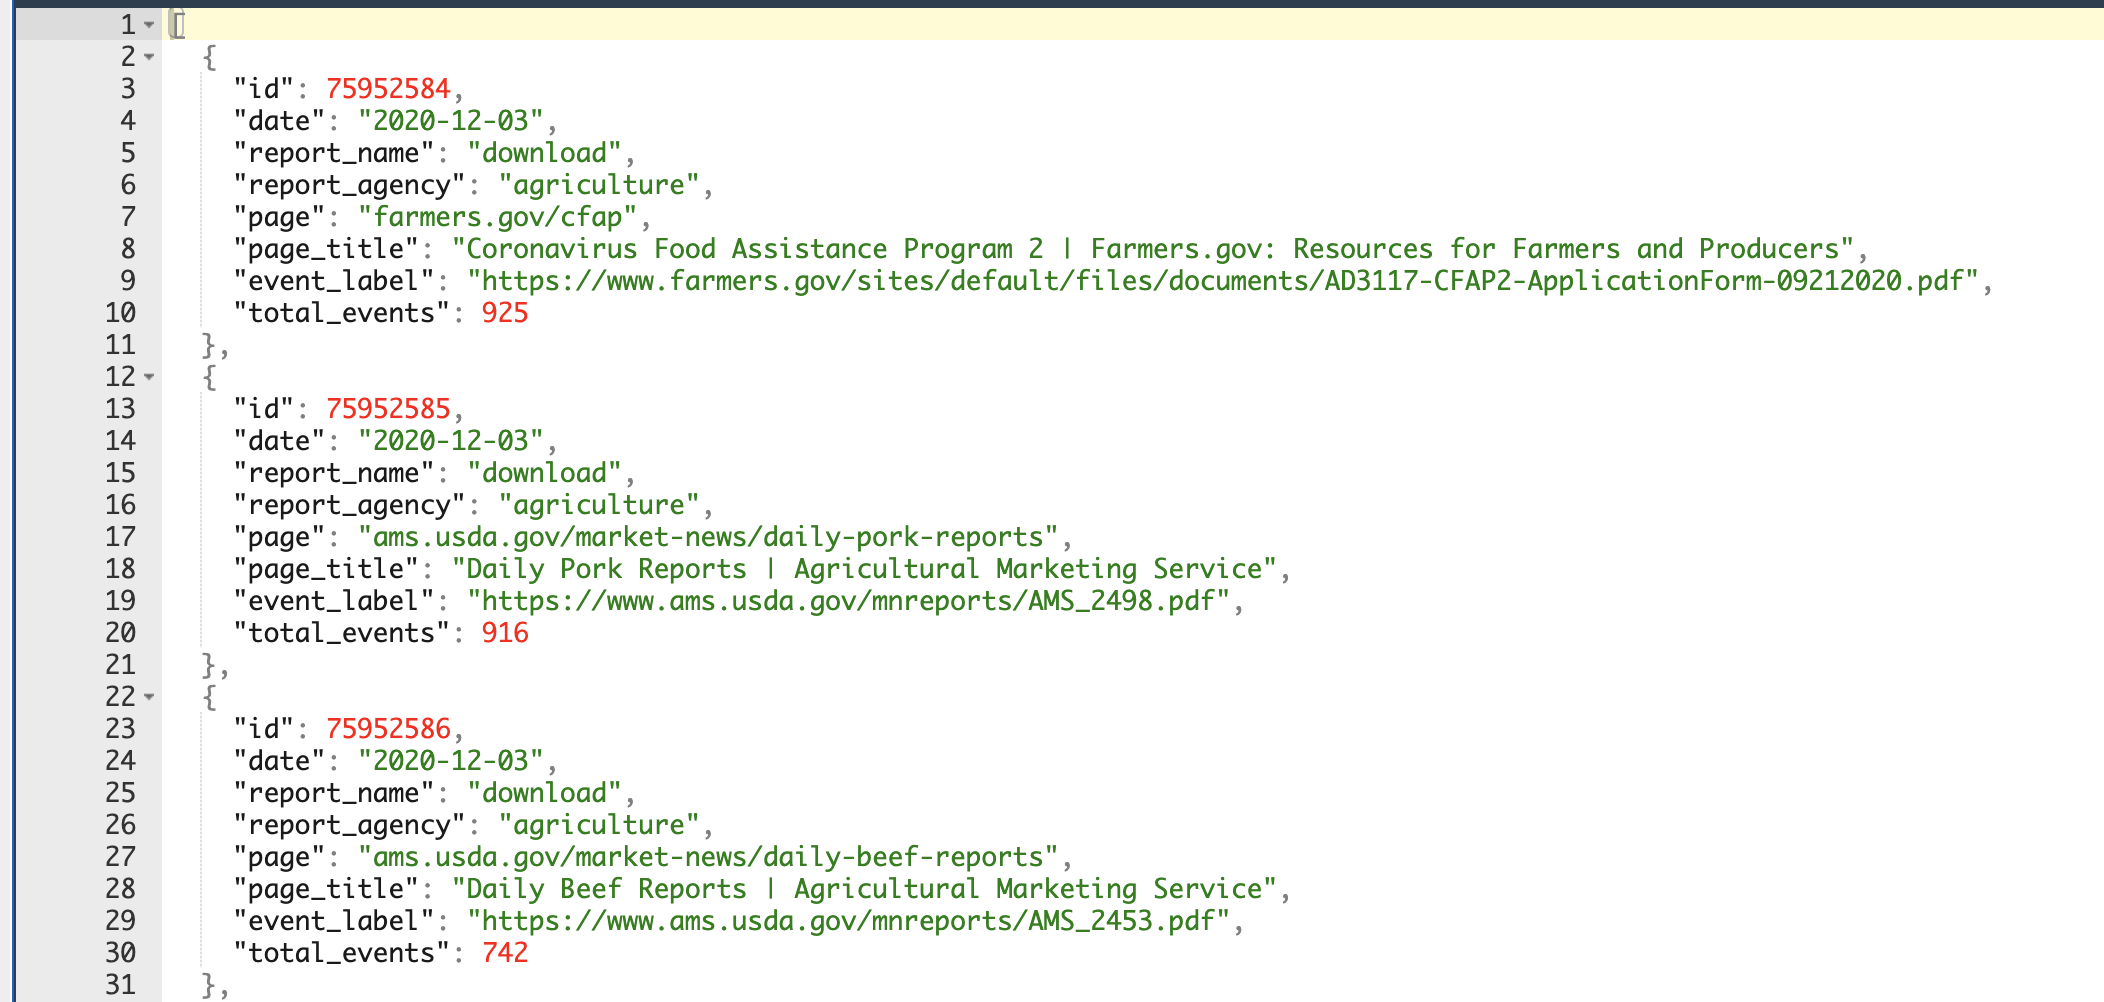
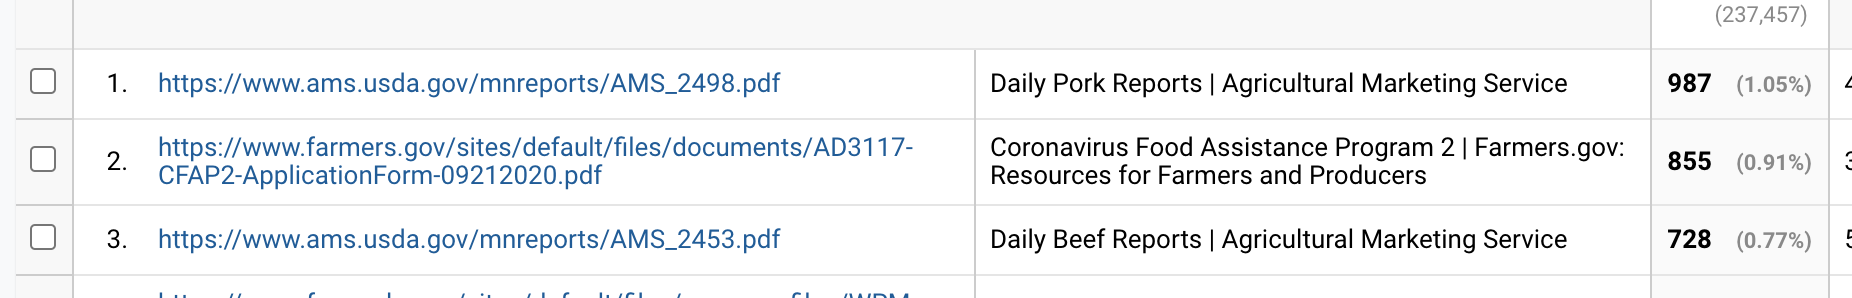
Hi again. Ok, so, first I took a quick look at the USDA data in the underlying GA account. At first glance and after spot checking the data on a few individual days, it looks as if USDA averages around 100,000 downloads per day, give or take. This was the case yesterday, as well as in October, July, and June from the days I spot checked. The top downloaded file is usually around 900-1000 downloads each day, per GA. Then I looked at the most recent CSV at https://analytics.usa.gov/agriculture/data/, which seems to correlate (roughly) with what I see in GA. So then I loaded https://api.gsa.gov/analytics/dap/v1.1/agencies/agriculture/reports/download/data?api_key=DEMO_KEY1 and I see the top files have about 900 downloads, so it appears correct. Granted, I haven't added up the total. How are you adding all the downloads for the month via the API? Are you pulling the endpoint daily and parsing it to add up the total, or running an API call with the date filter for the month? |
|
Here's the top entries from the API: Compared with the info from GA: Not exact (which is suspected due to API sampling thresholds), but they are in the same ballpark. |
|
Every day we run this script and it pulls data from 2019-01-01 to the previous day. Currently, the data set is ~550K rows (is this result set large enough for GA to use sampling?). I ran the script from August 1st of this year to yesterday and it had ~14K rows matching the first image above. |
|
hmmm, so each day it re-runs almost 2 years of data? would it be possible to do it in smaller chunks? I am not sure I fully grasp your system but fragmenting the reports into smaller date ranges may help. |
|
I'd like to apologize for misspeaking earlier. The first image is simply a count of the number of rows when grouping by the month for this year. This is the total downloads for each month when running the script from 2019-01-01 to 2020-12-02: I ran the script over a smaller chunk (just from 12-01 to 12-02) and got the same number of rows and downloads for December as when running from 2019-01-01 to 12-02. |

|
I'm really pretty stumped here. The download report has a floor of 100 downloads to make the list for any given day, but I can't see anything that we did that would cause such a precipitous drop in total downloads. @ryanhofdotgov or @echappen, if you have any thoughts, let me know. |
|
Okay, looking at some more info.... I think the GA API was on the fritz and is now reporting correctly. For example, if I run the GA report for USDA downloads for 7/1, I get the following: This shows 89 rows of 100 downloads or more. Alternatively, if I run the download endpoint of the API for 7/1/2020 (https://api.gsa.gov/analytics/dap/v1.1/agencies/agriculture/reports/download/data?api_key=DEMO_KEY1&before=2020-07-01&after=2020-07-01), I end up with over 1000 rows of download data for the day, and with all the numbers repeating multiple times (663, 548, 499, etc), which points to really heavy sampling. My hunch now is that the data from before was incorrect, but that it has rectified itself now. @jcb8qe, did you see this volume, 4M downloads per month, for all of 2019 as well? |
|
Morning. Here is the total downloads grouped by (month, year) for 2019 and 2020. I pulled this data this morning. We are still seeing a sharp decline from August of this year to present. They are also well below the numbers from 2019. |

What kind of issue?
Hi, thanks for reading my post.
We use the analytics.usa.gov API to track downloads for the agriculture agencies. Since August, we've seen abnormally low download numbers and are wondering if a potential bug is the result.
I have attached two images which leads us to believe an underlying bug is the issue.
(# of downloads, month) for 2020. As you can see it dramatically drops off in August:

Another view:

Thank you,
Justin
The text was updated successfully, but these errors were encountered: