As explained in the README.md file, it's easy to debug Tilck's kernel while it's
running inside a QEMU virtual machine. By default, the run_nokvm_qemu script
runs QEMU with the -s option, a shorthand for -gdb tcp::1234. Therefore,
once Tilck has booted we can connect with GDB as if we'd do for any other process
debugged remotely:
$ gdb ./build/tilck_unstripped
Reading symbols from ./build/tilck_unstripped...
(gdb) target remote :1234
Remote debugging using :1234
need_reschedule () at /home/vlad/dev/tilck/include/tilck/kernel/sched.h:154
154	   return atomic_load_explicit(&__need_resched, mo_relaxed);
(gdb)
Or, we can set a breakpoint to kmain() during the boot stage and then allow
the VM to run, in order to debug the kernel during its initialization. One detail
omitted in README.md is that we can change the port number used by QEMU's GDB
server using the GDB_PORT environment variable:
GDB_PORT=9999 ./build/run_qemu
Another detail omitted in the README.md is that running run_nokvm_qemu is
necessary, even if we have KVM installed on the machine. That's because QEMU
has limited support for debugging VMs using hardware-virtualization. For
example, it happens that breakpoints are missed.
One "detail" omitted until now is that running GDB like explained, triggers a warning about the auto-loading of GDB scripts found in unsafe locations like:
Reading symbols from ./build/tilck_unstripped...
warning: File "/home/vlad/dev/tilck/build/tilck_unstripped-gdb.py" auto-loading has been declined by your `auto-load safe-path' set to "$debugdir:$datadir/auto-load".
To enable execution of this file add
        add-auto-load-safe-path /home/vlad/dev/tilck/build/tilck_unstripped-gdb.py
line to your configuration file "/home/vlad/.gdbinit".
To completely disable this security protection add
        set auto-load safe-path /
line to your configuration file "/home/vlad/.gdbinit".
For more information about this security protection see the
"Auto-loading safe path" section in the GDB manual.  E.g., run from the shell:
        info "(gdb)Auto-loading safe path"
To allow GDB to load our custom script, add the following line in your ~/.gdbinit
file:
add-auto-load-safe-path <ABSOLUTE-PATH-OF-TILCK-BUILD-DIRECTORY>
Also, for a better debug experience add also:
set print pretty on
After that, GDB won't complain anymore and it will load Tilck's custom GDB script,
as expected and the tilck_unstripped-gdb.py GDB script will import other scripts
from the other/gdb_scripts directory.
The scripts will add both custom pretty printers and custom commands. Plus,
there's a special command called list-tilck-cmds to list all the custom
commands:
Reading symbols from ./build/tilck_unstripped...
(gdb) list-tilck-cmds
list-tasks
list-procs
list-tilck-cmds
get-task
get-proc
get-handle2
get-handle
get-curr
get-currp
(gdb)
This command will enlist all the tasks on the system:
(gdb) list-tasks

$14 = (struct task *) 0xc0062c00
        {tid =     1, pid =     1, SLEEPING, cmdline = /initrd/bin/init}

$15 = (struct task *) 0xc7b82400
        {tid =    36, pid =    36, SLEEPING, cmdline = /bin/ash}

$16 = (struct task *) 0xc7b83000
        {tid =    37, pid =    37, SLEEPING, cmdline = /initrd/bin/init}

$17 = (struct task *) 0xc7b83400
        {tid =    38, pid =    38, SLEEPING, cmdline = /initrd/bin/init}

        ------------------ Kernel threads ------------------

$18 = (struct task *) 0xc01f8d00 <buf+36096>
        {tid = 10001, RUNNABLE, kthread_name = wth_run}

$19 = (struct task *) 0xc01f9200 <buf+37376>
        {tid = 10002, RUNNABLE, kthread_name = wth_run}

$20 = (struct task *) 0xc01f9900 <buf+39168>
        {tid = 10004, SLEEPING, kthread_name = fb_blink_thread}

$21 = (struct task *) 0xc01f9a00 <buf+39424>
        {tid = 10005, SLEEPING, kthread_name = fb_update_banner}

$22 = (struct task *) 0xc01f9b00 <buf+39680>
        {tid = 10006, RUNNING, kthread_name = idle}

$23 = (struct task *) 0xc01f9e00 <buf+40448>
        {tid = 10007, SLEEPING, kthread_name = wth_run}

$24 = (struct task *) 0xc01f9f00 <buf+40704>
        {tid = 10008, SLEEPING, kthread_name = clock_drift_adj}

$25 = (struct task *) 0xc002bd00
        {tid = 10010, SLEEPING, kthread_name = wth_run}

$26 = (struct task *) 0xc0062100
        {tid = 10011, SLEEPING, kthread_name = wth_run}

(gdb)
Similar to list-tasks, but it will show just the user processes. Note: while
for the moment there's no multi-threading support, in the future there might be
and, each user process might be associated to more than 1 task (thread).
(gdb) list-procs

$27 = (struct process *) 0xc0062cb0
        { pid =     1, cmdline = '/initrd/bin/init' }

$28 = (struct process *) 0xc7b824b0
        { pid =    36, cmdline = '/bin/ash' }

$29 = (struct process *) 0xc7b830b0
        { pid =    37, cmdline = '/initrd/bin/init' }

$30 = (struct process *) 0xc7b834b0
        { pid =    38, cmdline = '/initrd/bin/init' }

(gdb)
Dump the struct task for the task TID.
(gdb) get-task 1
$33 = *(struct task *) 0xc0062c00 = {
  tid                  = 1,
  pi                   = (struct process *) 0xc0062cb0,
  state                = TASK_STATE_SLEEPING,
  kthread_name         = 0x0,
  is_main_thread       = true,
  running_in_kernel    = true,
  stopped              = false,
  was_stopped          = false,
  vfork_stopped        = false,
  traced               = false,
  kernel_stack         = 0xf802e000,
  args_copybuf         = 0xc0073000,
  io_copybuf           = 0xc0070000,
  wstatus              = 0,
  timeslice_ticks      = 1,
  total_ticks          = 3,
  total_kernel_ticks   = 2,
  ticks_before_wake_up = 0,
  timer_ready          = false,
  wobj                 = *(struct wait_obj *) 0xc0062c84 = {
    type = WOBJ_TASK,
    extra = 0,
    tid = <any child>
  },
  state_regs           = *(struct x86_regs *) 0xf802fd34 = {
    resume_eip   = 0xc010321d <asm_save_regs_and_schedule+45>,
    custom_flags = 0x00000000,
    gs           = 0x0010,
    es           = 0x0010,
    ds           = 0x0010,
    fs           = 0x0010,
    edi          = 0xf802fef4,
    esi          = 0x00000000,
    ebp          = 0xf802fdcc,
    esp          = 0xf802fd6c,
    ebx          = 0x00000000,
    edx          = 0xc0062c38,
    ecx          = 0x00000000,
    eax          = 0xc0135748,
    int_num      = -1,
    err_code     = 0x00000206,
    eip          = 0x00000002,
    cs           = 0x0002,
    eflags       = 0x00000296,
    useresp      = 0xc012a0a7,
    [true_eip]   = 0xc0135748 <sys_waitpid+592>
  }
}
(gdb)
Dump the struct process for the process PID.
(gdb) get-proc 1
$34 = *(struct process *) 0xc0062cb0 = {
  pid                 = 1,
  cmdline             = "/initrd/bin/init",
  parent_pid          = 0,
  pgid                = 1,
  sid                 = 1,
  brk                 = 0x8051000,
  initial_brk         = 0x8050000,
  children            = {36, 37, 38},
  did_call_execve     = true,
  vforked             = false,
  inherited_mmap_heap = false,
  str_cwd             = "/",
  handles             = {0, 1, 2, 3},
  mi                  = (null)
}
(gdb)
Dump the base handle struct for the given handle.
(gdb) get-handle2 1 0
$35 = *(struct fs_handle_base *) 0xc00615c0 = {
  pi         = 1,
  fs         = 0xc01f9ce0 <buf+40160>,
  fs_type    = devfs,
  fd_flags   = 0,
  fl_flags   = 32768,
  spec_flags = (none),
  pos        = 0
}
Exactly like get-handle2, but assumes as PID the current one.
Dump the struct task of the current task.
(gdb) get-curr
$39 = *(struct task *) 0xc01f9b00 = {
  tid                  = 10006,
  pi                   = <kernel_process_pi>,
  state                = TASK_STATE_RUNNING,
  kthread_name         = 0xc01a2d44 "idle",
  is_main_thread       = false,
  running_in_kernel    = true,
  stopped              = false,
  was_stopped          = false,
  vfork_stopped        = false,
  traced               = false,
  kernel_stack         = 0xf801a000,
  args_copybuf         = 0x0,
  io_copybuf           = 0x0,
  wstatus              = 0,
  timeslice_ticks      = 3,
  total_ticks          = 342,
  total_kernel_ticks   = 342,
  ticks_before_wake_up = 0,
  timer_ready          = false,
  wobj                 = *(struct wait_obj *) 0xc01f9b84,
  state_regs           = *(struct x86_regs *) 0xf801bf8c = {
    resume_eip   = 0xc0103115 <asm_irq_entry+58>,
    custom_flags = 0x00000000,
    gs           = 0x0010,
    es           = 0x0010,
    ds           = 0x0010,
    fs           = 0x0010,
    edi          = 0x00000000,
    esi          = 0x00000000,
    ebp          = 0xf801bff0,
    esp          = 0xf801bfc4,
    ebx          = 0x00000000,
    edx          = 0x00000000,
    ecx          = 0x00000000,
    eax          = 0x00000157,
    int_num      = 32,
    err_code     = 0x00000000,
    eip          = 0xc012a6ac <idle+91>,
    cs           = 0x0008,
    eflags       = 0x00000246,
    useresp      = 0x00000000,
    useresp      = 0x00000000,
    ss           = 0x0000
  }
}
(gdb)
Like get-curr, but dumps the struct process. Note: in this case, pid is 0
because the current task is a kernel thread, therefore get-currp dumps the
special kernel_process_pi object.
(gdb) get-currp
$38 = *(struct process *) 0xc0212290 = {
  pid                 = 0,
  cmdline             = (null),
  parent_pid          = 0,
  pgid                = 0,
  sid                 = 0,
  brk                 = 0x0,
  initial_brk         = 0x0,
  children            = {1},
  did_call_execve     = false,
  vforked             = false,
  inherited_mmap_heap = false,
  str_cwd             = "/",
  handles             = {},
  mi                  = (null)
}
As mentioned in the README.md file, Tilck has a nice developer-only feature called
debug panel or dp. To open it, just run the dp wrapper program.
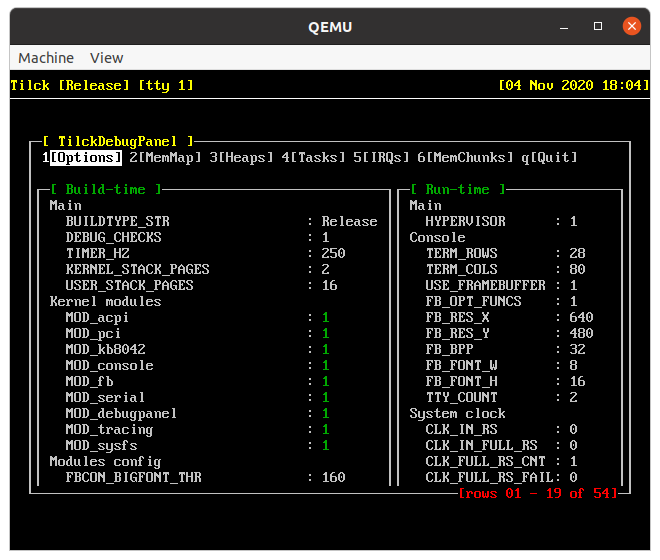
Using it is trivial: just switch tabs using the digits and scroll up and down their
content using the PAGE_UP and PAGE_DOWN keys. Its most interesting feature is
probably its embedded syscall tracer. To use it, first go to the tasks tab.
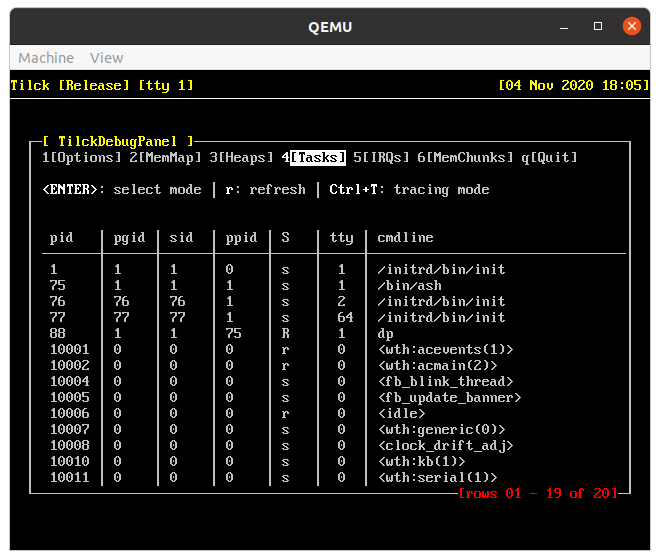
Then, enter in select mode by pressing ENTER and select a user process. After that,
mark it as traced by pressing t. Finally, enter in tracing mode by pressing Ctrl+T.
In alternative, it's possible to enter in tracing mode directly by running tracer. Once
there, press h for the help menu.
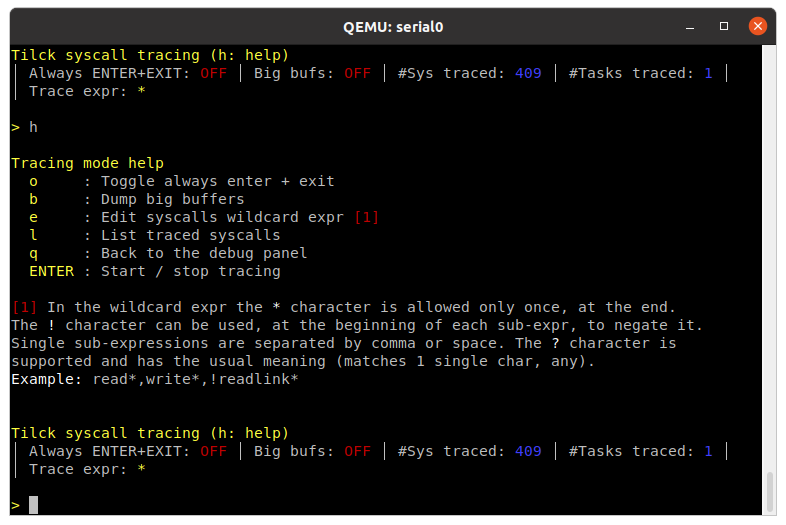
Once there, press ENTER to start/stop the syscall tracing.
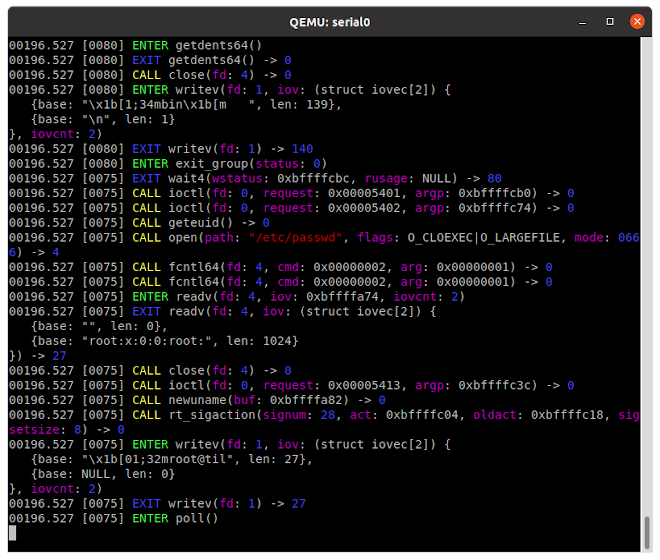
This whole feature is particularly useful if the debug panel is run on a serial console:
this way its possibile to see at the same time the traced program and its syscall trace.
To do that, run the qemu VM this way:
./build/run_qemu -serial pty
In addition to the VM window, you'll see on the terminal something like:
char device redirected to /dev/pts/4 (label serial0)
Open another virtual terminal, install screen if you don't have it, and run:
screen /dev/pts/4
You'll just connect to a Tilck serial console. Just press ENTER there and run
dp as previously explained.
Note: recent versions of QEMU (>= 4.0) have a built-in serial console that can be
opened by using its GUI, without special command-line options and without using the
screen application.
While Tilck's bootloader looks and behaves the same way no matter if we did a
classic BIOS boot or a UEFI boot, internally there are two bootloaders with
fundamentally different implementations, compiled in a completely different way
which just share the main logic (see common_bootloader_logic()) using a
an interface implemented by the two variants (see struct bootloader_intf).
Therefore, from now on, we should talk either about the legacy bootloader or
about the UEFI bootloader.
The legacy bootloader has 3 stages. Initially, the BIOS loads its first stage (512 bytes) at a predefined address and jumps into it in x86 real mode. There, we relocate to a different segment and load both the 2nd and the 3rd stages at once in a way that's AS IF everything were loaded at once in a contiguous chunk of memory. After that, we jump to the 2nd stage. In the 2nd stage, we enter in protected mode and jump into the 3rd stage.
With GDB we cannot really debug code running in real mode, but the good thing is that the 1st and the 2nd stages are small part of the legacy bootloader and should never really need to be touched. Therefore, we'll talk only about debugging the 3rd stage, which runs in 32-bit protected mode like the whole Tilck kernel and it's also mostly written in C. Steps:
-
Run:
./build/run_nokvm_qemu -S. The-Soption will force QEMU to stop before the boot stage. -
In a different console, run GDB with:
gdb ./build/boot/legacy/stage3/elf_stage3_unstripped -
Connect to remote GDB server with:
target remote :1234 -
Place a breakpoint in the early entry code (
_start) or in the C main function (bootloader_main()). -
Allow the VM to run with the
continueGDB command. -
Debug as usual. Note: avoid stepping inside
realmode_call()because it makes the CPU to enter in (un)real mode (mostly undebuggable with GDB) and then to re-enter in protected mode.
The setup for debugging the UEFI bootloader is quite different from anything
we've seen so far. First of all, since UEFI applications are shared libraries
that can be loaded by the firmware anywhere in system's memory, we need to get
from the bootloader itself its base address in order to debug the application.
To do that, we need first to enable the EFI_BOOTLOADER_DEBUG CMake config
option (see the building doc to learn how to do that). After that, we'll
run GDB and pass that BaseAddr to it, while loading the shared library using
the add-symbol-file command:
-
Enable the
EFI_BOOTLOADER_DEBUGconfig option -
Run QEMU:
./build/run_efi_qemu32. The bootloader will stop early displaying a similar to the following:------------ EFI BOOTLOADER DEBUG ------------ Pointer size: 4 JumpToKernel: 0x61392F3 BaseAddr: 0x6137000 Press ANY key to continue... -
Run GDB without arguments:
gdb -
Connect to QEMU's gdb server with:
target remote :1234 -
Add the EFI's app
.sofile at the right address:add-symbol-file build/boot/efi/ia32/libefi_app_ia32.so <BaseAddr> -
Set your breakpoints and say GDB to continue the execution
-
Press a key in QEMU's window
-
Enjoy debugging with GDB!
To debug the 64-bit EFI bootloader, run run_efi_qemu64 and use the file
build/boot/efi/x86_64/libefi_app_x86_64.so for symbols. It's worth noticing
that, virtually there should be no reason to do that and that it won't be
possible to debug with GDB the i386 kernel when running on a x86_64 QEMU virtual
machine. See bug 1686170 on launchpad.net.
By looking at the body of the if (EFI_BOOTLOADER_DEBUG) statement, some readers
might notice that BaseAddr has a 0x1000 (4 KB) offset from EFI's ImageBase.
That's because the first load segment starts at that offset n the ELF file:
$ readelf -l ./build/boot/efi/ia32/libefi_app_ia32.so

Elf file type is DYN (Shared object file)
Entry point 0x8200
There are 4 program headers, starting at offset 52

Program Headers:
  Type           Offset   VirtAddr   PhysAddr   FileSiz MemSiz  Flg Align
  LOAD           0x001000 0x00000000 0x00000000 0x0dd60 0x0dd60 R E 0x1000
  LOAD           0x00f000 0x0000e000 0x0000e000 0x0e7bb 0x0e7bb RW  0x1000
  DYNAMIC        0x019000 0x00018000 0x00018000 0x000a0 0x000a0 RW  0x4
  GNU_STACK      0x000000 0x00000000 0x00000000 0x00000 0x00000 RWE 0x10

 Section to Segment mapping:
  Segment Sections...
   00     .hash .text .plt
   01     .sdata .data .dynamic .rel .rel.plt .dynsym .dynstr
   02     .dynamic
   03
And GDB expects the address of the first load segment (anything before that isn't supposed to be loaded in memory). While in theory that offset might change if the ELF headers get bigger, in practice that will never happen as long as we don't add new sections and segments in the binary (and we don't have a reason to do that). Therefore, it's reasonable fine to just hard-code that +0x1000 offset for the sake of simplicity instead of having to add it manually or to implement any sort of tricky solutions supporting it to change.