Skip to content
New issue

Have a question about this project? Sign up for a free GitHub account to open an issue and contact its maintainers and the community.

By clicking “Sign up for GitHub”, you agree to our terms of service and privacy statement. We’ll occasionally send you account related emails.

Already on GitHub? Sign in to your account

constant CPU and "Energy Impact" usage on macOS Sierra #474

Closed
deepsweet opened this issue Jul 28, 2016 · 47 comments
Closed

constant CPU and "Energy Impact" usage on macOS Sierra #474

deepsweet opened this issue Jul 28, 2016 · 47 comments
Labels
help wanted Contributions wanted towards the issue 📊 Type: Performance Issue contains information about a performance issue in Hyper

Comments

@deepsweet
Copy link

deepsweet commented Jul 28, 2016

Hi. I'm always getting this even with a single empty and silent tab opened:

screen shot 1

screen shot 2

plugins: ['hyperterm-atom-dark', 'hyperterm-subpixel-antialiased']

Other electron-based apps on my machine like Atom in idle mode are barely noticeable in Activity Monitor top rows, so I don't think that this issue is related to macOS Sierra Public Beta which I use. Any thoughts?

@timothyis timothyis added help wanted Contributions wanted towards the issue 😰 Can't Reproduce Reviewer can't reproduce issue and maybe needs more information labels Jul 29, 2016
@deepsweet deepsweet changed the title constant CPU and "Energy Impact" usage on macOS constant CPU and "Energy Impact" usage on macOS Sierra Jul 29, 2016
@tisghans
Copy link

Coming right under chrome. reproducable for me
screen shot 2016-07-31 at 1 48 07 am

@lukeed
Copy link

lukeed commented Aug 10, 2016

Reproducible. With 1 empty tab in focus:

3% to 7% CPU usage
2.7 energy impact.

Using El Capitan

@pokono
Copy link

pokono commented Sep 6, 2016

+1

@olivier-w
Copy link

olivier-w commented Nov 2, 2016

With one idle tab open:
screen shot 2016-11-02 at 2 00 39 pm

Seems related to issues in #574

@developit
Copy link
Contributor

FWIW I only saw this when using zsh.

@thealpa
Copy link

thealpa commented Nov 2, 2016

I can reproduce this as well (one idle tab):
hyper

@lukeed
Copy link

lukeed commented Nov 2, 2016

Can confirm @developit's comment. My experience occurred while using ZSH. But that's all I use, so I can't compare against a non-ZSH env.

@marclundgren
Copy link

@lukeed
Copy link

lukeed commented Dec 6, 2016

@marclundgren Oh My ZSH

@obrassard
Copy link

I have this problem too on Mac OS sierra 10.12.1
screenshot

@marclundgren
Copy link

@obrassard are you using any ZSH addons? hyperzsh, antigen, oh-my-zsh, zgen?

@obrassard
Copy link

@marclundgren No, the only plugins I am using are "hyperpower", and "hyper-blink"

@marclundgren
Copy link

@obrassard oh, I don't mean hyper addons. Are you using any of these? #474 (comment)

@obrassard
Copy link

obrassard commented Dec 13, 2016

@marclundgren Not to my knowledge but were can I verify just for sure ?

@audunolsen
Copy link

I too meet this problem with only 1 empty tab in focus:

screenshot 2016-12-13 22 42 15

macOS Sierra 10.12.1
Hyper 1.0.0

@marclundgren marclundgren mentioned this issue Dec 17, 2016
2 tasks
@masonlong
Copy link

Also experiencing this with only 1 empty tab
screen shot 2016-12-28 at 12 06 34 pm

@chadlavi
Copy link

+1, reproducible here too. No significant difference for me between zsh and bash, hyper drains my battery at a rate of about 5% a minute (!!) either way.

screen shot 2017-02-21 at 9 48 34 pm

@gsklee
Copy link
Contributor

gsklee commented Feb 22, 2017

@rauchg @codetheory @leo Someone please remove the Can't Reproduce tag please, I think that jumped to the conclusion too soon.

@gsklee
Copy link
Contributor

gsklee commented Feb 22, 2017

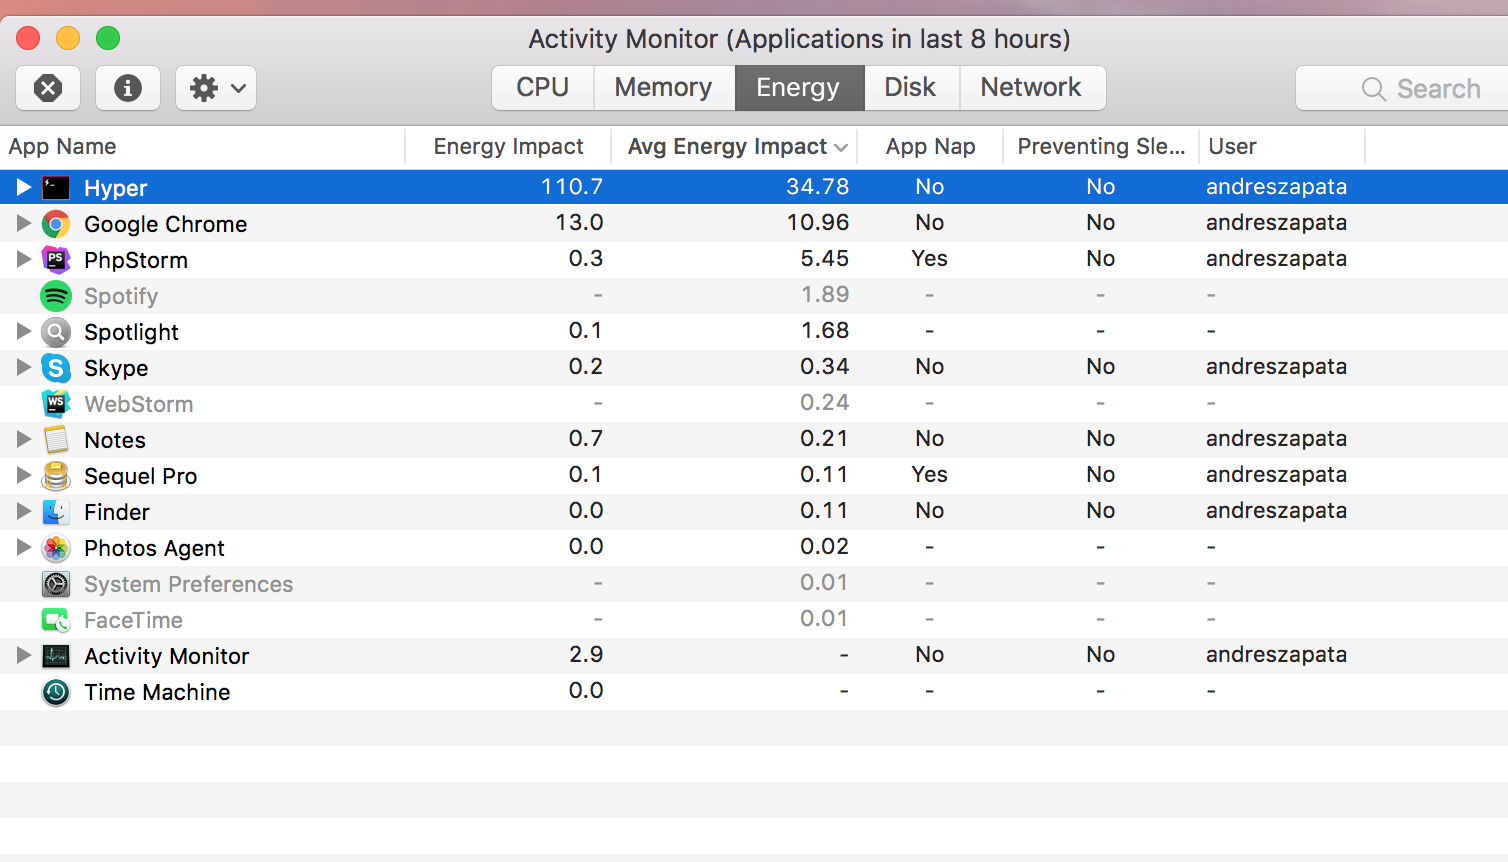
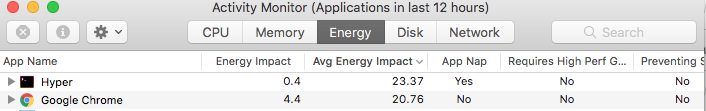
The readings fluctuate a bit but on average Hyper indeed is using way more resources comparing with iTerm2:

CPU
http://i.imgur.com/6ZQ5Y78.png

Energy
http://i.imgur.com/KMRen4t.png

@marclundgren
Copy link

and @gsklee do you have any hyper plugins running? also which version?

@gsklee
Copy link
Contributor

gsklee commented Feb 23, 2017

@marclundgren freshly installed v1.2.1

@henriqueioneda
Copy link

On mine it's even worse, it goes above 50 on energy impact and I've got 23 avg for a 8 hour use (chrome was around 18!). MacOS Sierra and some plugins (hyperpower, hyperterm-close-on-left, hyperlayout, hyperterm-ayu). Are we getting somewhere here?

@marclundgren
Copy link

@henriqueioneda can you take measurements again but with no plugins installed?

@henriqueioneda
Copy link

Without the plugins, it is about 13 energy impact while I'm in it (sometimes when I enter and leave directories it has peaks of 20~30). For the 8 hour average I'd have to wait more, but I guess its about it. I installed the plugins one by one, and it seems hyperpower is the most impactant (makes energy impact go over 50), and the others seem to have little to no impact (except maybe for the theme hyperterm-ayu which raises it by 5, I guess). I guess I'll just stop using hyperpower =(

@masonlong
Copy link

I've had to disable hyperpower too for the same reason. Really sad, it was such a fun feature..

@lukeed
Copy link

lukeed commented Mar 10, 2017

I think most people who've stopped by to report this issue weren't using the hyperpower plugin. I, for one, wasn't. So let's not chase that rabbit hole, thinking it's the root cause.

@bfkss
Copy link

bfkss commented Mar 11, 2017

I support @lukeed on his theory.
I for one wasn't using any plugins and now my plugins are hyperterm-atom-dark (which is a theme) and hyperlinks. And this hasn't change my energy impacts

@vcfvct
Copy link

vcfvct commented Mar 27, 2017

It actually uses more than the IDE(Intellij) which compiles stuff and run app servers all the time.
Please investigate.
I only have 2 plugin:

 plugins: [
        'hyper-solarized-dark',
        'hyperpower'
  ],

hyper-drain

@lukeed
Copy link

lukeed commented Mar 27, 2017

@vcfvct Turn off hyperpower for starters. The way it works certainly increases CPU, energy, and mem usage. We're trying to track Hyper (alone).

@rauchg
Copy link
Member

rauchg commented Mar 27, 2017

I think it's important that whoever is experiencing this opens the Dev Tools to see if it's actually Hyper. Keep in mind that other than auto updates, Hyper should be idle most of the time (unless you're constantly streaming something to a terminal). It's no different from any other React webapp.

@rauchg
Copy link
Member

rauchg commented Mar 27, 2017

And by actually Hyper I mean: I want to make sure that the energy impact is not being obtained from the child processes spawned by the ptys started by Hyper (e.g: that it's measuring any CLI program you launched or are working with)

@lukeed
Copy link

lukeed commented Mar 27, 2017

@rauchg Yeah, for me it was Hyper. Here's when I pinned down that it was, in fact, just Hyper & nothing else affecting.

I believe that it probably all comes down to Electron. I read somewhere recently that VSCode was having similar, unexplained energy/CPU impacts, and someone was able to trace it down to a blinking cursor...which ended up being an Electron-responsible behavior.

Found the reference: microsoft/vscode#22900

@vcfvct
Copy link

vcfvct commented Mar 27, 2017

@rauchg Yes, I did not run any cli/ssh/other nodejs script in the hyper. Just ONE idle tab in my home(~/).
After I have 2 hours meeting I found my batter dropped to 20%, which usually last for 6-7 hours. That's why I open activity manager and found this issue. The shell I use is Fish which I do not think matters since it is the shell I have long before using hyper.js.
@lukeed As for the hyperpower, i do not want to get rid of since it really makes the terminal fun to use. Hopefully there will be a solution....

@vcfvct
Copy link

vcfvct commented Mar 29, 2017

Did some more comparison, i can almost confirm the problem is from the fancy/good-looking hyperpower plugin. With the plugin added, the Energy Impact in OSX(10.10.5 Yosemite) activity monitor always shows 30-40 even with 1 tab idle and background. If I remove the plugin and reload, the Energy Impact comes down to 0.1-1 which is just a bit more compare to the native Terminal App.

Looks like I have to get rid of the lovely hyperpower plugin which is hyper in power consumption. 😭

@Tyriar
Copy link
Contributor

Tyriar commented Apr 3, 2017

Note that this is different but similar to what VS Code was seeing. In VS Code it's related to a 1 second CSS animation being evaluated every frame, here it's firing the animation frame callback every frame and redrawing.

If this is indeed the cause, you should try only drawing the frame in hyperpower only when there are particles to draw. Right now this https://github.com/zeit/hyperpower/blob/8853a1852721e377179347d01d624214adcbd26a/index.js#L149 runs every animation frame, meaning on every frame with 0 particles, a callback is fired which clears the context and a new one is registered.

Instead you should only request the next frame when there are > 0 particles and fire a new one when particles are created. Essentially what I did here for xterm.js xtermjs/xterm.js#521

@albinekb albinekb removed the 😰 Can't Reproduce Reviewer can't reproduce issue and maybe needs more information label Apr 4, 2017
@chabou chabou added the 📊 Type: Performance Issue contains information about a performance issue in Hyper label Apr 19, 2017
@ccorcos
Copy link

ccorcos commented Apr 24, 2017

I'm interested to hear any solutions you find :)

@andfelzapata
Copy link

I'm having the same issue, 3 tabs open, one of them is running Laravel Elixir's gulp watch.

My machine is fairly new. Only plugin I have is hyperterm-cobalt2-theme.

screen shot 2017-07-07 at 12 36 46 pm

@Tyriar
Copy link
Contributor

Tyriar commented Jul 7, 2017

@andfelzapata expanding Hyper might give some useful details on the sub-processes there.

@fengwang
Copy link

I can confirm this bug with version 1.3.3.1754.

@fengwang
Copy link

screen shot

@rayoplateado
Copy link

In windows Hyper drains battery really fast...
hyper

@Tyriar
Copy link
Contributor

Tyriar commented Aug 2, 2017

@fengwang do you have some plugin installed that's running netstat? It looks like that is a big reason for your case.

@Moumouls
Copy link

Comfirm HyperPower problem :
With hyperpower : 1 Tab in Idle Mode -> 46 energy impact
Without hyperpower ( but no more funny ) : 1 Tab in Idle Mode -> 3 energy impact

@johnbwoodruff
Copy link

I have the same issue. I opened Hyper and then left it there. Only changed directories once then left it. It's been sitting there for several hours, and it's saying it's using significant energy. Here's my activity monitor:

screen shot 2018-01-12 at 1 31 53 pm

I don't have any plugins installed except a theme. Any work being done on this issue?

@lukeed
Copy link

lukeed commented Jan 12, 2018

Guys, hyperpower is 100% going to increase energy impact. It's mounting a requestAnimationFrame listener which looks for something to do every frame — that's what it's supposed to do.

This issue/thread isn't for hyperpower 😅

Let's try to keep it clear for hyper resource usage directly.

Commented because I'm still subbed to this thread, and most every email I get about this issue mentions hyperpower lol

@johnbwoodruff
Copy link

Agreed. I'm referring specifically to hyper itself in my comment above.

@chabou
Copy link
Collaborator

chabou commented Jan 13, 2018

@jbw91 can you give me your Hyper Version?

Sign up for free to join this conversation on GitHub. Already have an account? Sign in to comment
Labels
help wanted Contributions wanted towards the issue 📊 Type: Performance Issue contains information about a performance issue in Hyper
Projects
None yet
Development

No branches or pull requests