missing reads region has valid insulation score #153
Comments
|
Hi! Grey regions denote masked regions. This is a feature of FAN-C, where regions can be declared "invalid", typically through filtering. If a bin has no reads, it is automatically declared invalid (=masked) when you are using FAN-C format. The low coverage filter ( When using a different format, there is no direct equivalent for masking. When using Juicer files, FAN-C relies on White regions are simply regions with 0 contacts. What file formats and normalisation method were you using for the different plots? What preprocessing pipeline did you use? If you use the same pipeline for both plots, my guess would be that the second sample still has signal somewhere in those bins (outside of the matrix section you are showing). If you are using FAN-C, stricter filtering as outlined above could fix the issue. |
|
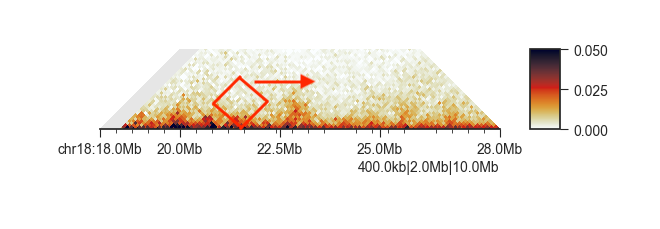
On closer inspection of the image, you can even see some pixels with signal in those regions that prevent masking of the bin: |

|
Hi there, Thank you for the detailed explanation! That made a lot of sense to me. I am using Juicer with SCALE normalization to preprocess both samples and load the .hic file in the fan-c to call insulation and plot. To follow up, is there any difference between the two different colors, like light gray and pure white? Many thanks then~ |
|
White regions are counted as Therefore you will observe a drop in insulation score at the predominantly white locations in your plots. Gray regions are masked, and therefore considered |
Hi there,
Thank you for maintaining the tool! I have a question regarding two of my samples. Looks like they both have the missing read regions from the Hi-C contact map (those white stripes between 72.2Mb to 72.4Mb).


I expected to see over those regions, there are no insulations scores since there are no valid aligned reads, like the first figure. However, you can see from the second figure even though it has missing reads, there are still valid insulation scores from the second panel. I wonder if this indicates there is sth wrong with the analysis or if it has some other interpretation.
Another question is, in truth, both of the samples contain large deletions around 45 kb, which actually locates the same position as the white stripes, so I wonder when a white/gray (sometimes it shows as gray color, I am not sure the difference between the two colors) regions show up in the heatmap, how to know if they are missing reads in the raw sequence or they are deletions for the sample?
Thank you for any of your incoming comments on this question!
The text was updated successfully, but these errors were encountered: