Jupyter notebooks and web app that uses statistical analysis to prove climate change is real!
-
Updated
Dec 8, 2022 - HTML
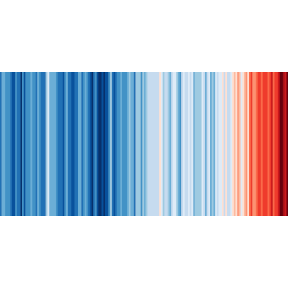
Global climate change refers to the rise of earth's temperature, caused by human factors. It originates from the greenhouse effect of certain gases in our atmosphere like carbon dioxide (CO2) or methane (CH4) that block the escaping heat. The concentration of these gases has risen dramatically by human impact since the mid of the 20th century, with the burning of fossil fuels (oil and gas) and deforestation being main causes of this rise. The observed and expected effects include more and longer periods of draught, wildfires and an increased number of extreme weather events.
Jupyter notebooks and web app that uses statistical analysis to prove climate change is real!
The frontend (phone) code for MECO₂, an app that tracks the CO₂ footprint of your everyday moves
Simple carbon intensity API for the GB grid
An online web application that presents the latest available energy related data for Pacific Islands Countries and Territories (PICTs)
A project for analyzing historical carbon emissions data. Explore trends, sector-specific insights, and country comparisons to inform climate policies and sustainability efforts. Includes visualizations, time series analysis, and forecasting tools.
🏭 A visual simulation of how decisions impact our carbon footprint, make with Unity3D.
Script to scrape website data transmissions carbon emissions from website carbon calculator websites
Reduce your carbon emissions by using The Carbon Bear App! It's the most efficient way to achieve a greener future.
Repository of the emission tracker mobile app. Built with Expo, TypeScript and common libraries from the React Native ecosystem.
OIM3690 Term Project: This website is about countries that ranked top 5 in carbon dioxide emissions. The objective of this website is to provide basic information of amount of carbon dioxide emission from these 5 countries and raise awareness of environmental protection and sustainability development. Domain www.zhihengwebtechproject.ninja
Simple animation demonstrating the logic of carbon credits (tradable certificates representing the right to emit a set amount of carbon dioxide). And their impact on overall carbon emissions.
The aim of this project is to highlight the significant energy consumption of data centres (DC) and develop a dashboard to analysis the cost of their carbon footprint and electricity consumption.
Project in Applied Data Analysis, EPFL 2019
carbontrack is a mobile app that will calculate the amount of CO2 emitted for a journey based on a user’s vehicle.
Canopi Climate API client library for JavaScript
React Native app that allows users to see how much carbon emission was released and how much they contribute to it
Created by Humanity