-
Notifications
You must be signed in to change notification settings - Fork 63
New issue
Have a question about this project? Sign up for a free GitHub account to open an issue and contact its maintainers and the community.
By clicking “Sign up for GitHub”, you agree to our terms of service and privacy statement. We’ll occasionally send you account related emails.
Already on GitHub? Sign in to your account
Fitting multiple models with a loop #374
Comments
|
Hey @juan-g-p! The following code works, library(fpp3)
gas <- us_gasoline %>% filter(year(Week) <= 2004)
mods <- list()
for (i in seq(1, 9)) {
mods[[paste0("model_name_", as.character(i))]] <- TSLM(Barrels ~ trend() + fourier(K = i))
}
my_model <- function(...){
model(gas, ...)
}
do.call(my_model, mods)The output is, |
|
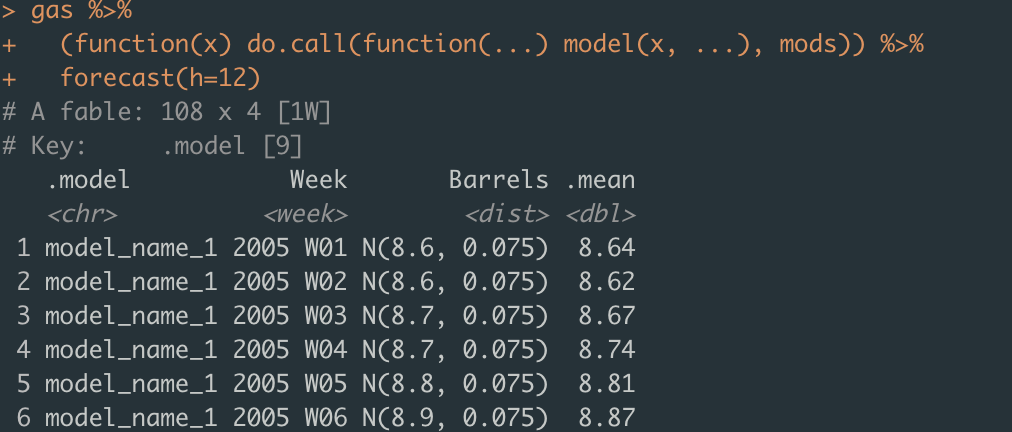
A tidier approach, library(fpp3)
gas <- us_gasoline %>% filter(year(Week) <= 2004)
mods <- list()
for (i in seq(1, 9)) {
mods[[paste0("model_name_", as.character(i))]] <- TSLM(Barrels ~ trend() + fourier(K = i))
}
gas %>%
(function(x) do.call(function(...) model(x, ...), mods)) %>%
forecast(h=12)The output is, |
|
Hello Federico, Thanks a lot. The code does indeed work. Thanks a lot for taking the time to solve this! I find however Rs syntax gets overly complicated. I love this library and find it provides an awesome framework, but I must admit sometimes the syntax for doing what should be a very simple task gets quite counter-intuitive. In any case, thanks again for the help! Very much appreciated! |
|
Here's how I would do it. I like to use Note that library(fpp3)
#> ── Attaching packages ──────────────────────────────────────────── fpp3 0.4.0 ──
#> ✔ tibble 3.1.8 ✔ tsibble 1.1.2
#> ✔ dplyr 1.0.10 ✔ tsibbledata 0.4.1
#> ✔ tidyr 1.2.0 ✔ feasts 0.3.0
#> ✔ lubridate 1.8.0 ✔ fable 0.3.2.9000
#> ✔ ggplot2 3.3.6
#> ── Conflicts ───────────────────────────────────────────────── fpp3_conflicts ──
#> ✖ lubridate::date() masks base::date()
#> ✖ dplyr::filter() masks stats::filter()
#> ✖ tsibble::intersect() masks base::intersect()
#> ✖ tsibble::interval() masks lubridate::interval()
#> ✖ dplyr::lag() masks stats::lag()
#> ✖ tsibble::setdiff() masks base::setdiff()
#> ✖ tsibble::union() masks base::union()
# Prepare the models for 1-9 harmonics
harmonics <- seq_len(9)
models <- lapply(harmonics, function(i) TSLM(Barrels ~ trend() + fourier(K = i)))
# Give the models names
names(models) <- paste0("K", harmonics)
# Estimate the models
gas <- us_gasoline %>% filter(year(Week) <= 2004)
fit <- gas %>%
model(!!!models)
# Compare the forecasts
fit %>%
forecast(h = "1 year") %>%
autoplot(filter(us_gasoline, year(Week) %in% 2003:2005), alpha = 1/3)Created on 2022-10-07 by the reprex package (v2.0.1) |
|
Hello Mitchell, Thanks a lot for your interesting answer. Both of them are pieces of code I will add to my arsenal. |


I am currently in a scenario where I need to fit multiple models where I just change one of the parameters.
I would like to have a loop from 1 to n and create a model definition for each of the values of K that I would then feed to the function model. I would like to store the model definitions in a dictionary (list) where I would have separately the model name and the model itself.
Thus far I have been able to create single model formuas and feed them to the function model in a successful manner:
My goal would be to have a set of model definitions created in a loop and stored in a list, which I would then feed to the function model as arguments
In python I would use list unpacking or dict unpacking to achieve this, but I fail to attain this in R. People suggest using do.call() but I fail to do this...
Could anybody please help?
The text was updated successfully, but these errors were encountered: