Aggregated trajectories - flow direction #273
-
|
Hi all, I am aggregating trajectories and would really like to see the flows direction as well, is this implemented ? Thanks! |
Beta Was this translation helpful? Give feedback.
Replies: 3 comments 3 replies
-
|
Do you have some dummy trajectories data you can share and what the actual expected flow direction would be? |
Beta Was this translation helpful? Give feedback.
-
|
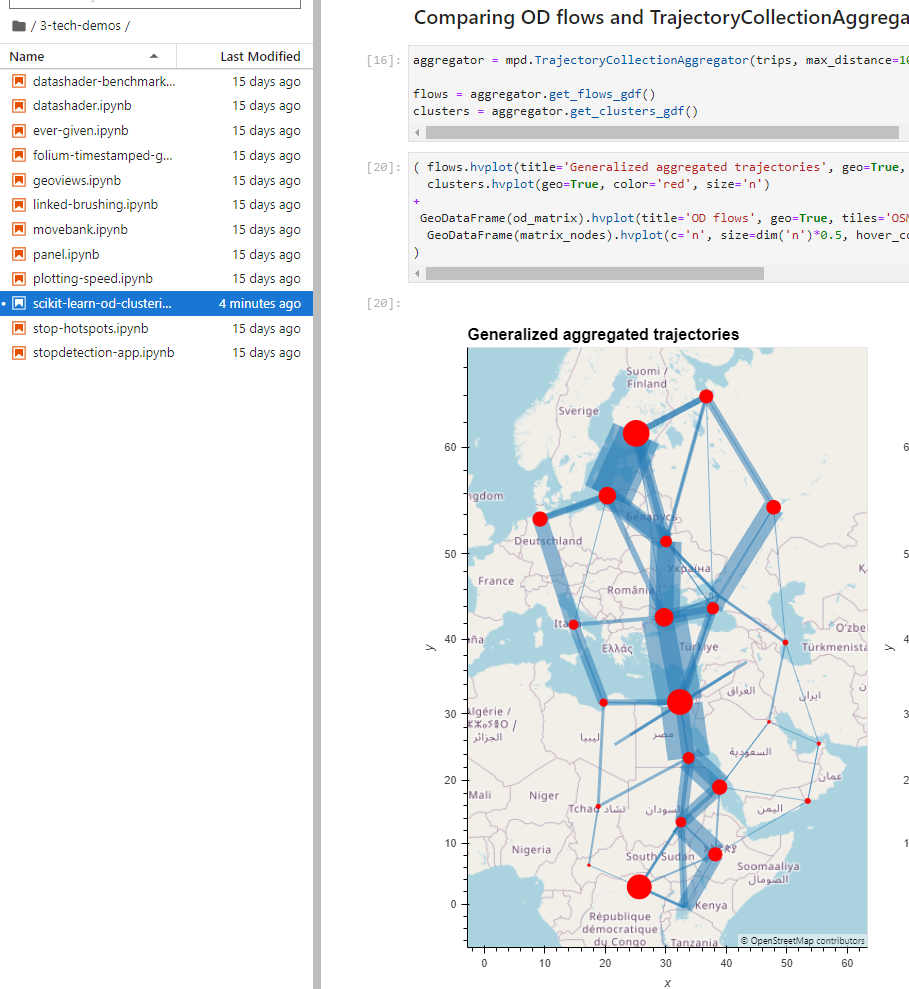
The flow direction is considered in the aggregations and results. However, the challenge is to visualize the flow direction in the map plots since geoviews has no line offset functionality |
Beta Was this translation helpful? Give feedback.
-
|
Thank you,
I understand.
Do you think it would be possible to visualize in seperate plots?
How is that information extracted from the aggregator?
[image: Seafloor Scene Icon]
…On Mon, 12 Dec 2022 at 08:45, Anita Graser ***@***.***> wrote:
The flow direction is considered in the aggregations ans results. However,
the challenge is to visualize the flow direction in the map plots since
geoviews has no line offset functionality
—
Reply to this email directly, view it on GitHub
<#273 (comment)>,
or unsubscribe
<https://github.com/notifications/unsubscribe-auth/A2ZPD6U5H3G6OQ3JX56FRYDWM3CYFANCNFSM6AAAAAAS25ZVZA>
.
You are receiving this because you authored the thread.Message ID:
***@***.***
com>
|
Beta Was this translation helpful? Give feedback.


The problem is tricky. What logic could be used to split the data into multiple plots?
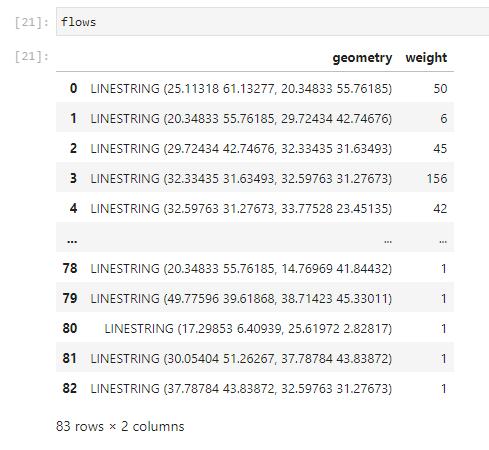
There is a convenience function called get_flow_gdf() that returns a GeoDataFrame with Linestrings:
https://github.com/anitagraser/movingpandas-examples/blob/main/3-tech-demos/scikit-learn-od-clustering.ipynb