Visual fields file format #95
Comments
|
Hey! The simulated visual field has a fixed width for each individual. This is usually measured in angles, which is currently 130° in each direction - giving individuals a FOV of 260° (let me know if this is not enough for you). These 260° have to be mapped to a fixed number of probes, though, which is currently 512. So for each angle/eye/depth layers you get 1.96 entries in the array there. Sorry for incomplete docs, hope this clears it up. |
|
Hi,
Thank you! |
|
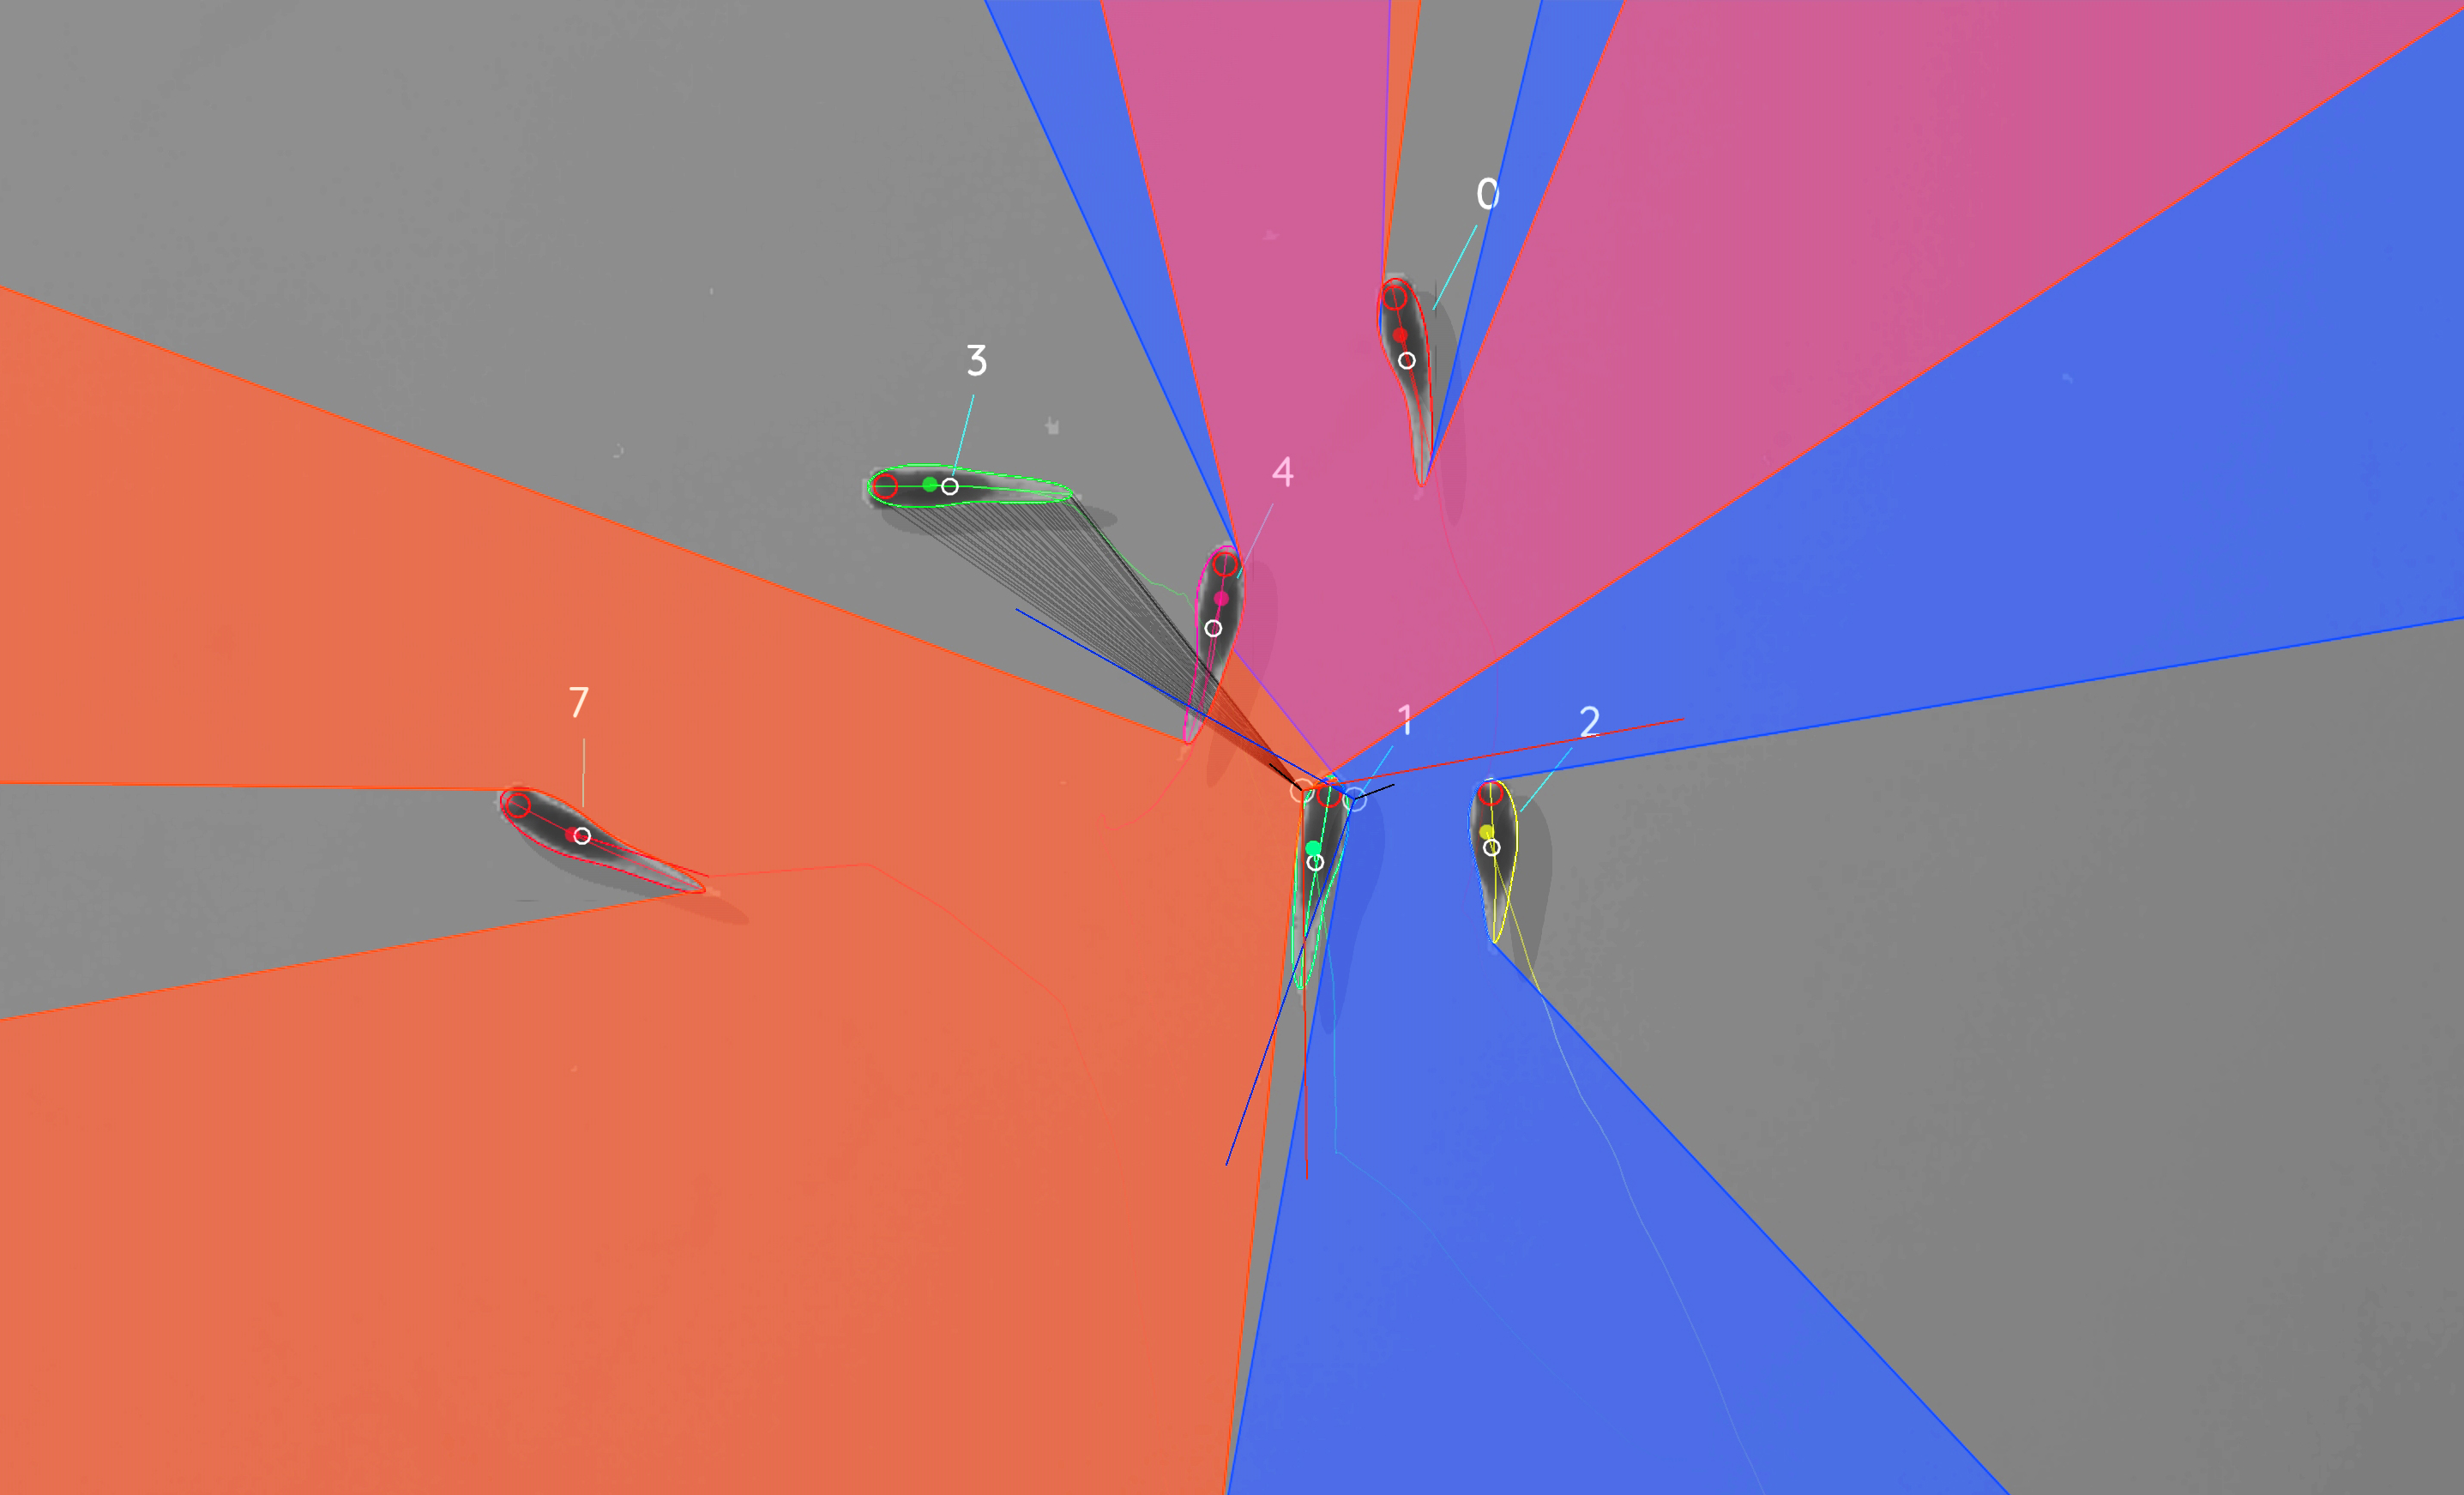
Hey, so if you look at the picture below, the grey lines are the second layer. The focal individual in the middle shoots "rays", conceptually, and the first individual that is hit by the ray is in the first layer. If it hits another individual afterward, then this individual will be in the second layer. The second question is a good question. Have had someone else ask recently and really need to get a working example for this. So essentially, this is how it is calculated: // rp is the absolute position of a collision candidate
// e.pos is the absolute position of an eye
double d = (SQR(double(rp.x) - double(e.pos.x)) + SQR(double(rp.y) - double(e.pos.y)));
// so d is essentially the squared-distance (p.x-e.y)^2 + (p.y-e.y)^2 in pixels(see Application/src/tracker/tracking/VisualField.cpp:368) Meaning you would basically take the square-root and that should be the euclidean distance in pixel coordinates. You will need the angle, too, if you want to calculate other things. Which is the index Let's hope this is correct. Let me know if that works for you! |
|
Hi, thank you very much for the clarification. However, I still have some problems interpreting the values of depth array from the visual field. In the picture below you can see a snapshot of the fish visual field for two time frames (959, 966):
I need to extract the distance between the fish eye and the object in the fish visual plus the related angle (see black arrow in the image). From the array called depth I have plotted the values for the first layer for each time frame related to the snapshot above:
My questions: Thank you very much for your help! |


|
I am a bit late with my response, but in the hopes that this might either still be relevant, or help people in the future - here goes. The angle of each datapoint index is calculated as follows: index = (angle0 - fov_range.start) / len * T(VisualField::field_resolution);So that means to get the angle from an index: index = (angle0 - 130) / 260 * 512
// if we bring angle0 to the left:
angle0 = index * 260 / 512 + 130And just to be clear: the Of course, that does not give you the angle marked in your pictures directly, but it gives you the angle for each dot in your Figure 2. Meaning that the angle is narrower in frame 966. than in 959, which makes sense. If you want the full angle range, you would have to add data from the second eye as well - it seems like you only plotted one eye. To get the distance, I refer you to the previous message, but essentially |
In the documentation the Visual fields file format contains one array for each parameter. The documentation states:
Each container holds multiple arrays, each are shaped Nx2x2x512 for N frames, 2 eyes and 2 depth-layers per eye.
Question: in the array shape, what 512 stands for?
Thank you
The text was updated successfully, but these errors were encountered: