PDF #95
Comments
|
Hi Guy, |
|
Hey Josiah, |
|
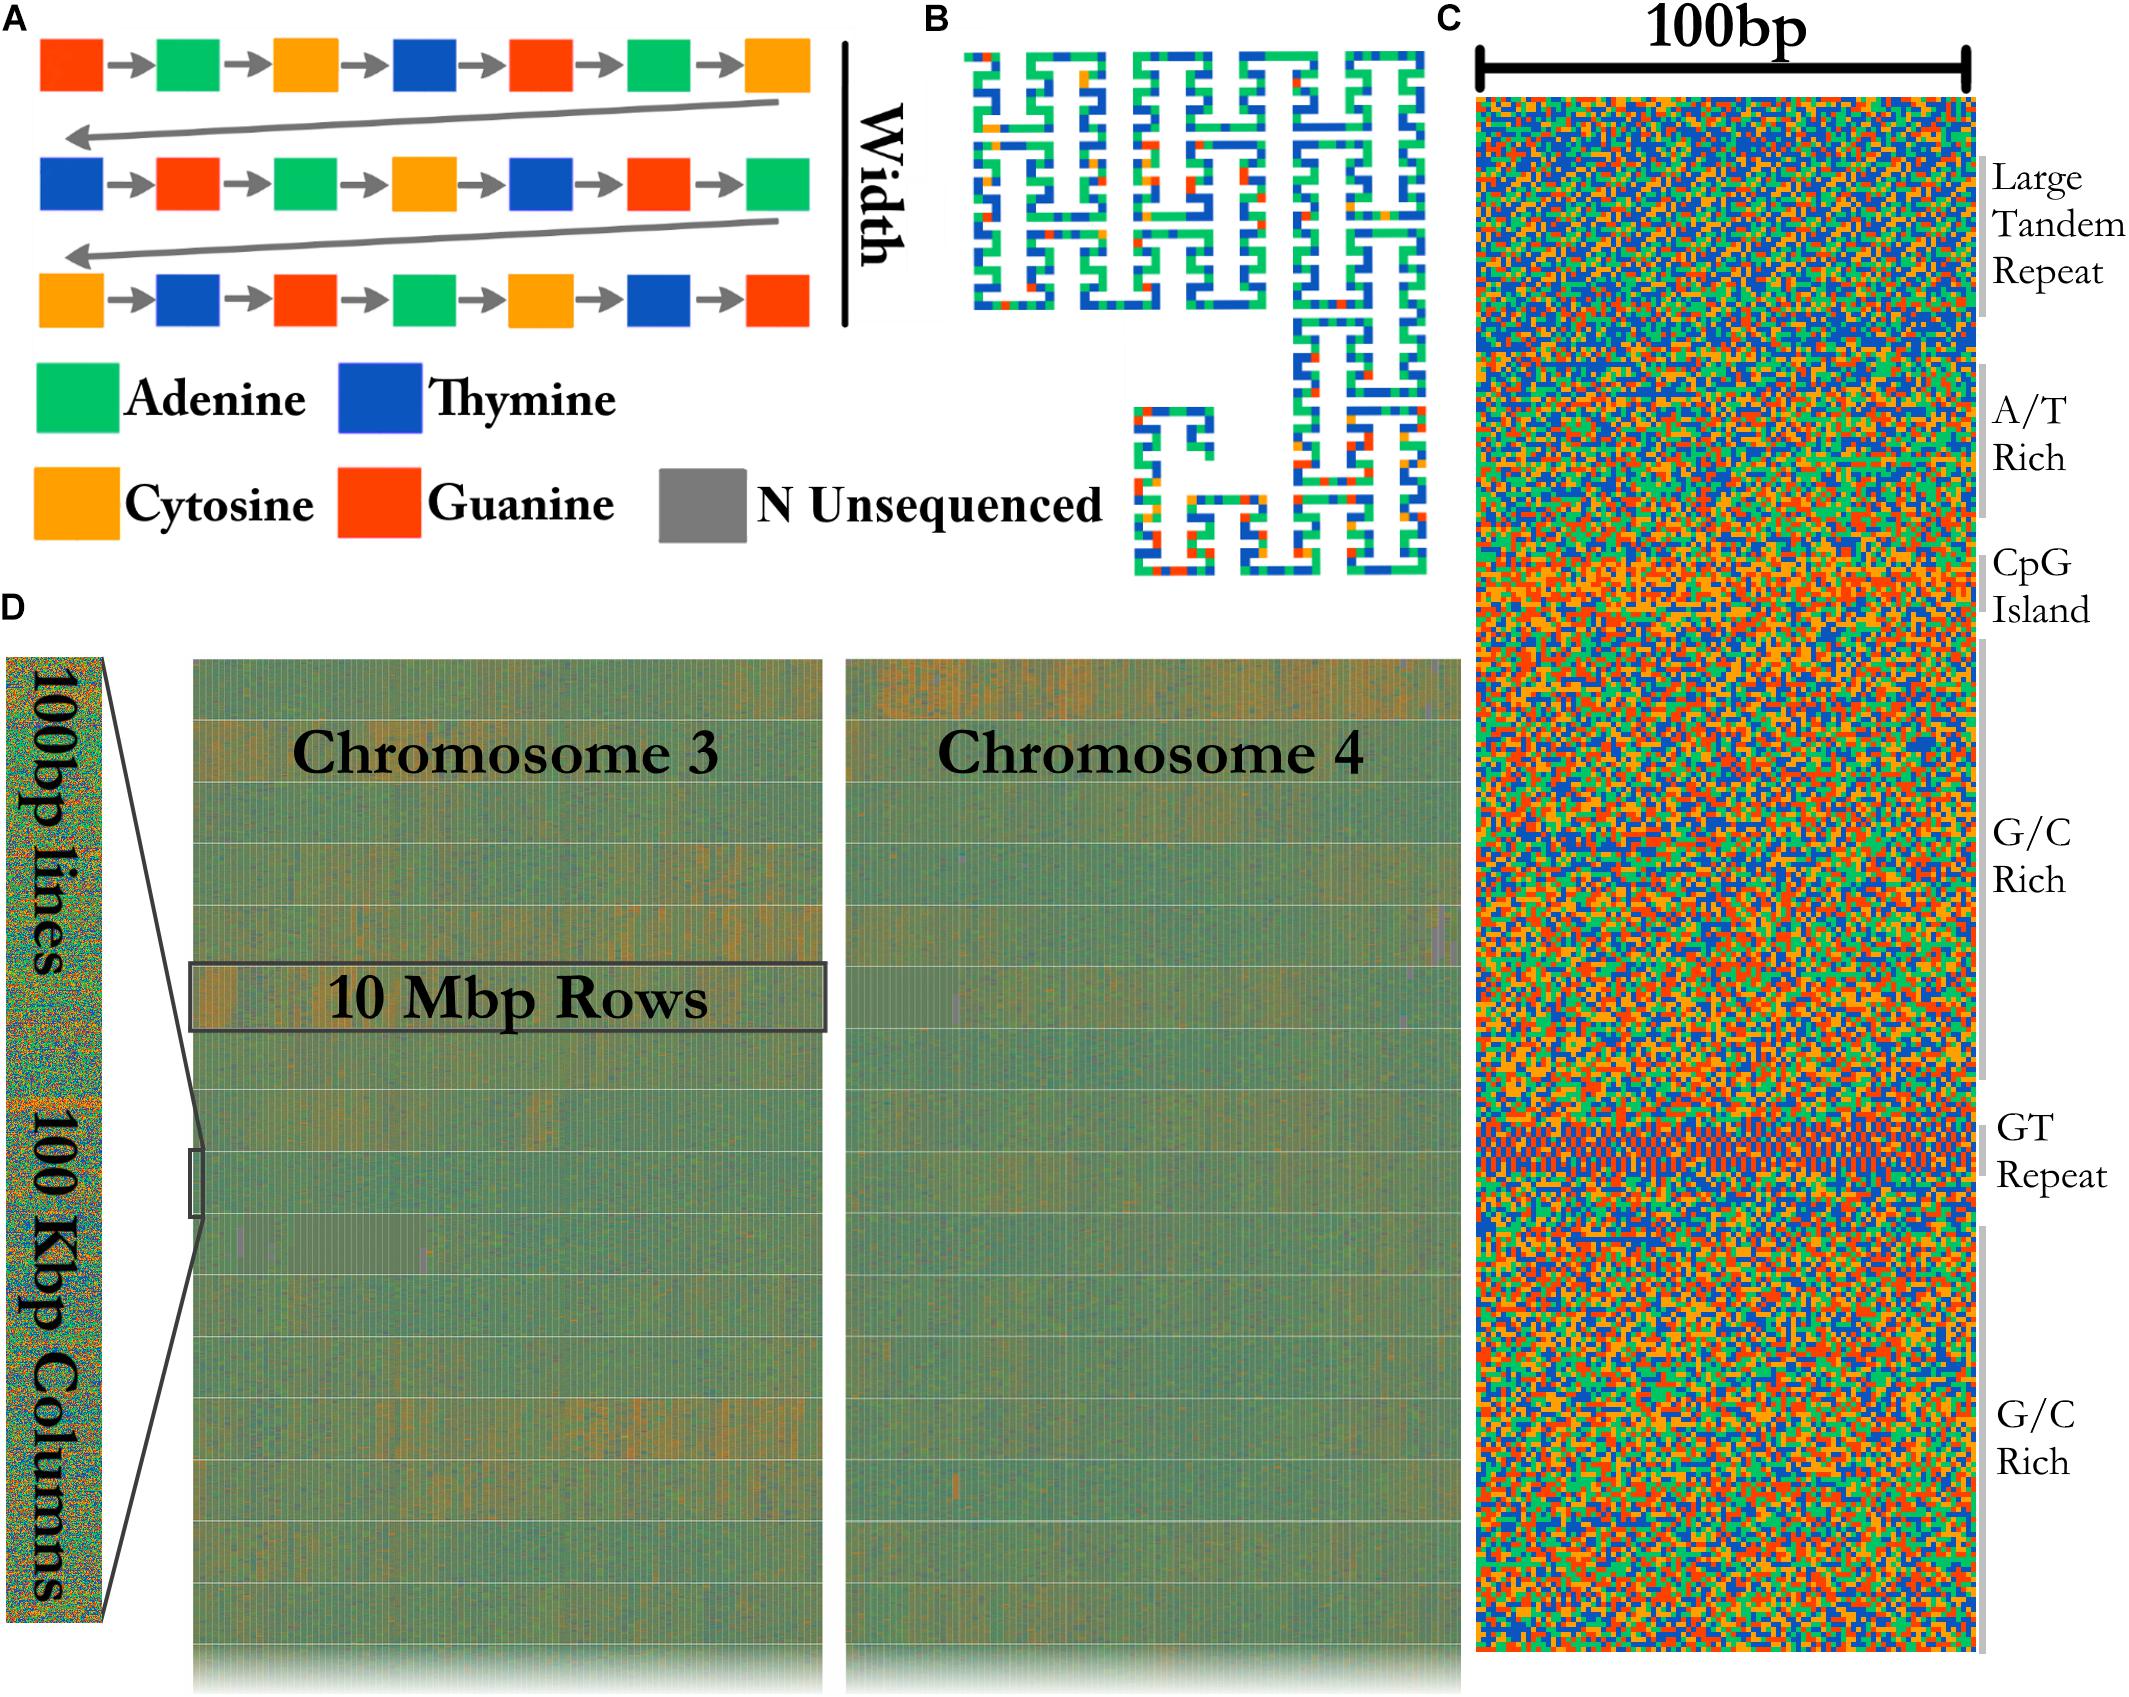
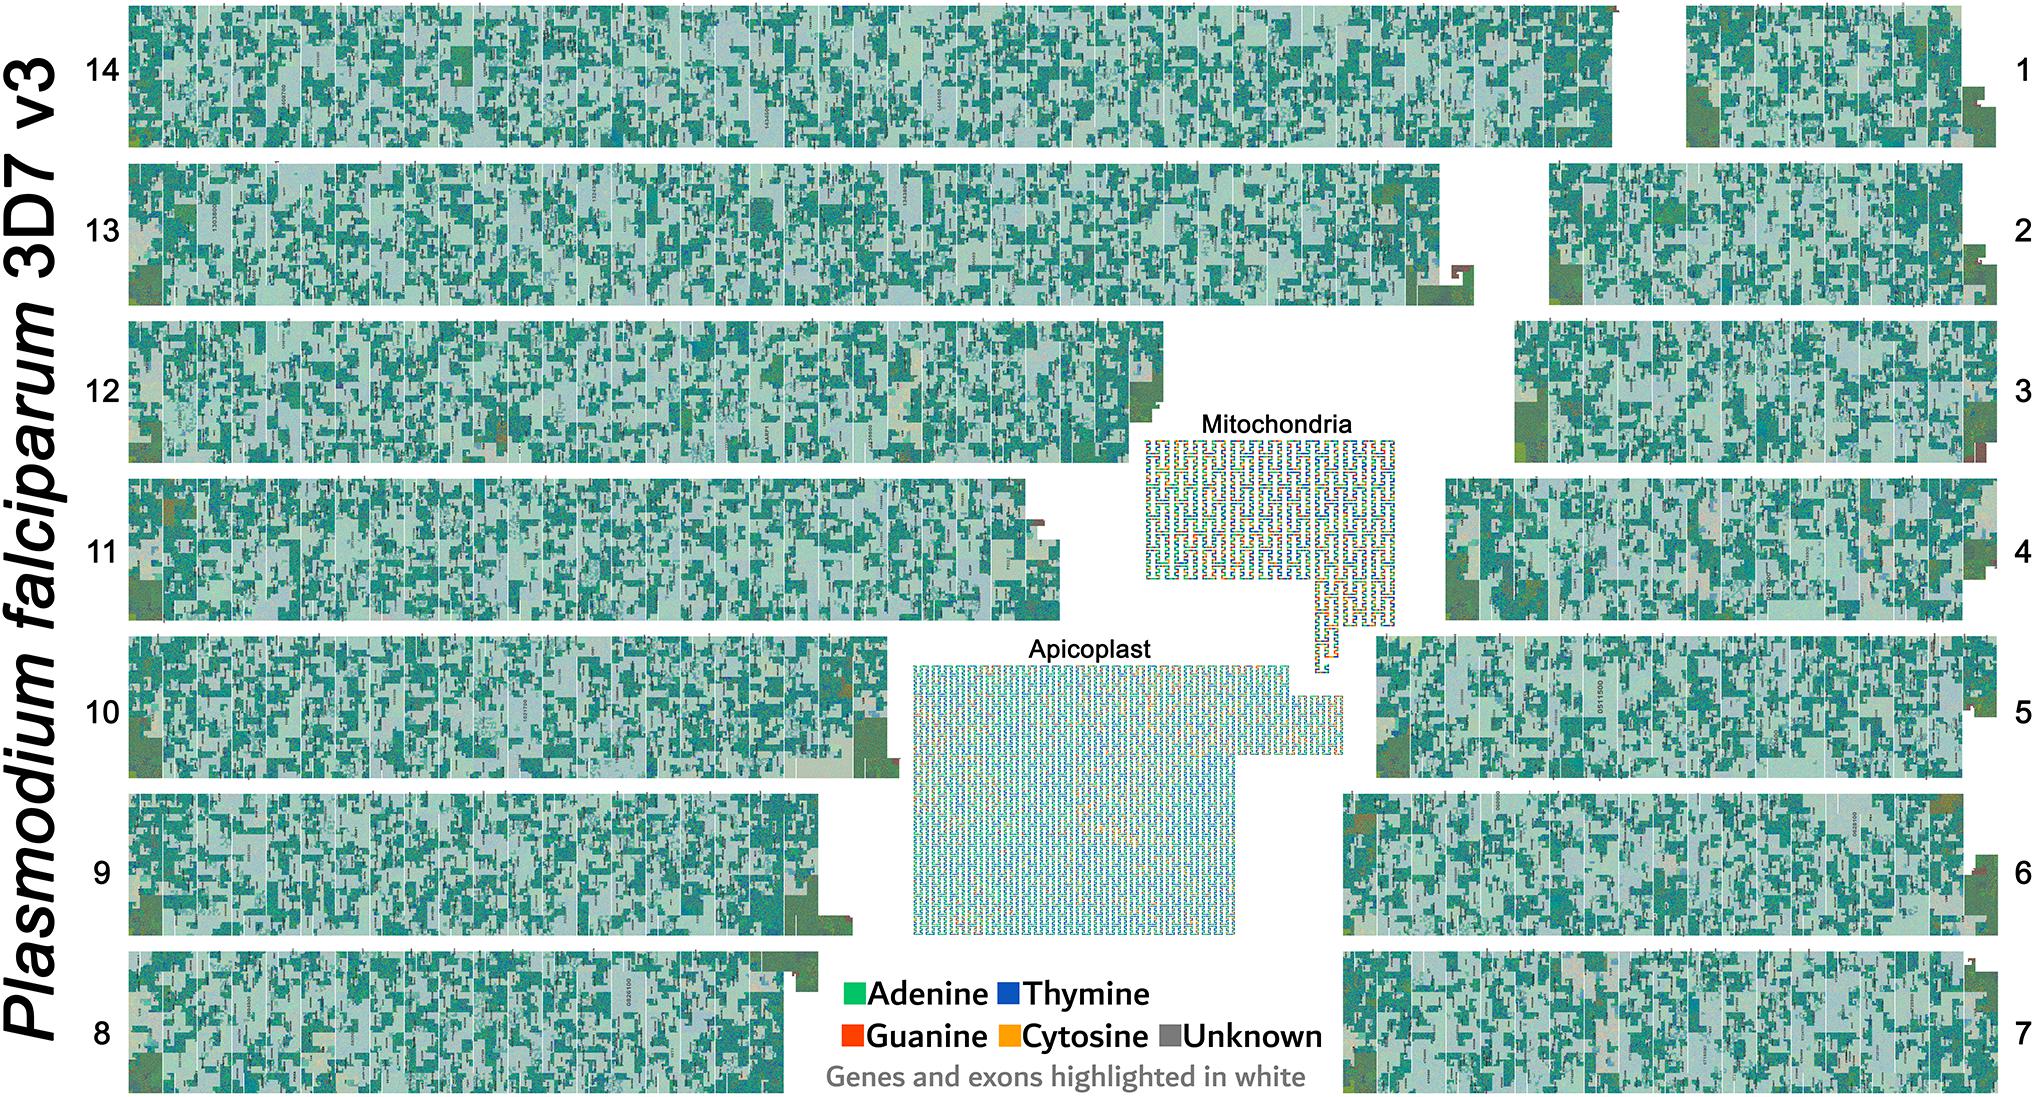
Hi Guy, By increasing the margin variable in the renderer from 0 to 1 you can get a visible space filling curve like the ones you can see in Figure 2 and Figure 8. That will help people understand how DNA continually snakes back on itself in repetitions. Yan Wong and I discussed ways to show annotations in the expanded space filling curve, but ultimately I decided to go with the light shading that you see in the final paper. It's a bit more clear and closely mirrors real world regional maps people are familiar with. The whole FluentDNA project is open source so people can hack on it to make educational figures, productions and posters. If you don't have access to any programmers, I might be able to do it eventually, but my October is looking pretty busy. What's your timeline?
|

|
Here's some guidance for Maxim to get started on this issue.
Annotations
How to Annotate with Ideogram MarginsIf you want the snaking maze look of DNA and also the ability to show an annotated gene region, you've got to find the outline of this complex area with margins around it. This is never a feature that I tackled, but looking at the code it's definitely possible.
Image Export Format: PDF
Good luck with your project. Let me know if you have any other questions. |
Hey,
is there a wat to get a single fasta as pdf instad of html format?
many thanks
The text was updated successfully, but these errors were encountered: