This is the WIP server-side version, client side version is here: github.com/jllord/sheetsee.js
The server-side version is in the repo sheetsee-cache. It uses Node.js to go to Google, get the spreadsheet data (with a Node.js version of Tabletop.js, thanks Max Ogden!) and save it on the server. This means every user that visits the page doesn't have to wait on Google's response to load the charts from the data.
When the server builds your page, it will build in your data as the variable gData. All you need to do is add your scripts to the bottom of the page. For the tables/templating you'll need to wrap them in an event listener so that it doesn't try and build them before the data has settled.
<script type="text/javascript">
    document.addEventListener('DOMContentLoaded', function() {
        // table/templating things the rest can be in their own script tags if you'd like
    })
</script>
You can run this locally and it will check your internet connection - if you're not online it will use the last saved data allowing you to develop offline, yay!
Once you clone the repo, navigate there in Terminal and type:
cd sheetsee-cache
npm install
node server.js
This will launch a local server you can visit and develop locally with in your browser.
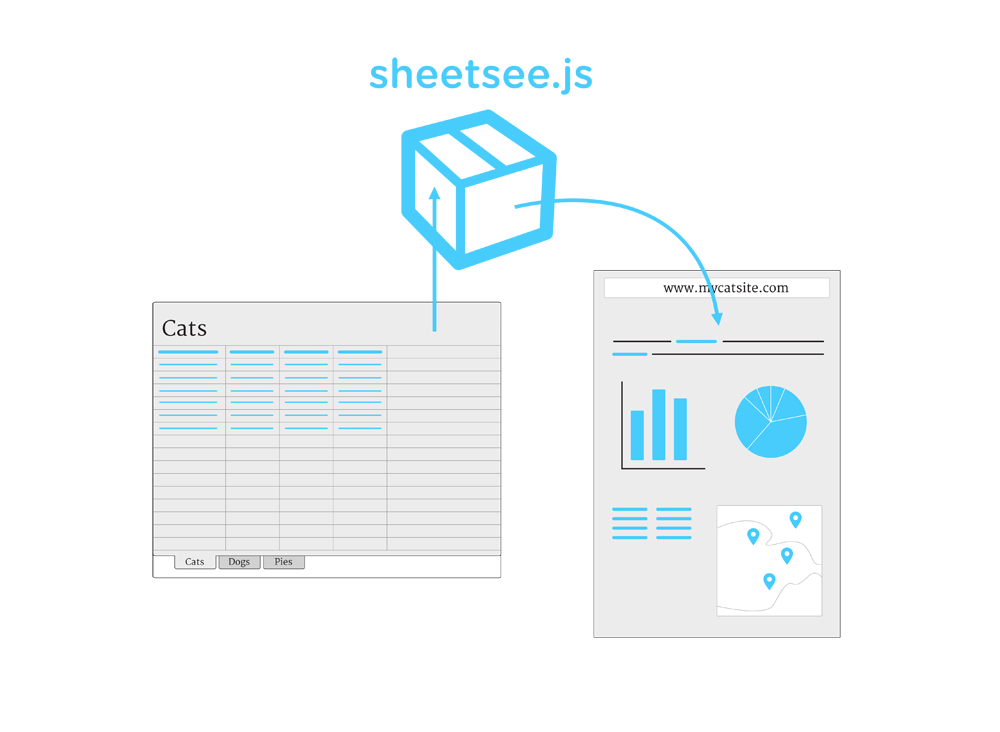
Sheetsee.js is a JavaScript library, or box of goodies, if you will, that makes it easy to use a Google Spreadsheet as the database feeding the tables, charts and maps on a website. Once set up, any changes to the spreadsheet will auto-saved by Google and be live on your site when a visitor refreshes the page.
Using Google Spreadsheets as the backend database is awesome because it is easy to use, share and collaborate with.
To use sheetsee.js you'll definitely need to know HTML, CSS and know JavaScript or be not afraid of it and just type what these docs tell you to type. Also, see JavaScript for Cats, Eloquent JavaScript or Mozilla's Developer Network.
Sheetsee.js depends on a few other awesome JavaScript libraries to make all this happen. First, Tabletop.js gets the data from the Google Spreadsheet and makes it nice. Once you have your data Sheetsee.js makes it easy to set up tables or templates with IChanHas.js(built on mustache.js), maps with Mapbox.js, and charts with d3.js. And jQuery of course powers most of the interactions. It also has many sorting and filtering functions built in so that you can display different parts of your data if you want. Each of these are explained in more detail below.
Sheetsee.js comes with a bare minimum stylesheet. This way you can customize your site to look the way you want to it or to match an existing site's design.
Sheetsee.js comes in two flavors, client-side (this repo) and server-side (sheetsee-cache. The client-side is the most approachable and straightforward, you just include sheetsee.js and the dependencies on your page and use sheetsee.js as normal.
The server-side version is built with Node.js and you'll need to understand Node and be publishing to a server that runs Node.js apps. This version saves the data on the server so that the browser doesn't have to fetch from Google at every request, which can sometimes be slow. You can set when the cache expires. It also allows for offline development, huzzah!
- Link to Sheetsee.js and dependencies in your HTML header.
- Create a place holder
<div>in your HTML for any chart, map or table you want to have. - Create templates for tables in
<script>tags. - Create a script tag that waits for the document to load and then executes any of the map, chart or tables you've specified in it.
- Set it and forget. Now all you need to do is edit the spreadsheet and visitors will get the latest information everytime they load the page.
Ignoring some HTML things to conserve space, you get the point. This gives you a page with a map of your spreadsheets points.
<html>
    <head>
        <script type="text/javascript" src="http://api.tiles.mapbox.com/mapbox.js/v1.0.0/mapbox.js"></script>
        <script type="text/javascript" src="js/ICanHaz.js"></script>
        <script type="text/javascript" src="js/jquery.js"></script>
        <script type="text/javascript" src="js/d3.js"></script>
        <script type="text/javascript" src="js/sheetsee.js"></script>
        <link href='http://api.tiles.mapbox.com/mapbox.js/v1.0.0/mapbox.css' rel='stylesheet' />
    </head>
    <style> #map {height: 600px; width: 600px;} </style>
    <body>
    <div id="map"></div>
    <script>
        optionsJSON = ["something", "something"]
        var geoJSON = Sheetsee.createGeoJSON(gData, featureElements)
        var map = Sheetsee.loadMap("map")
        Sheetsee.addTileLayer(map, 'examples.map-20v6611k')
        var markerLayer = Sheetsee.addMarkerLayer(geoJSON, map)
    </script>
    </body>
</html>
- Small newsrooms with data for stories but small dev teams.
- Friends or groups collaborating on data for a website/project.
- Using iftt.com to auto populate spreadsheets which are hooked to a website with Sheetsee.js.
- Hack Spots
- James Sconfitto make a map of his relationship with his wife <3
This bit is the same for both client-side and server-side versions.
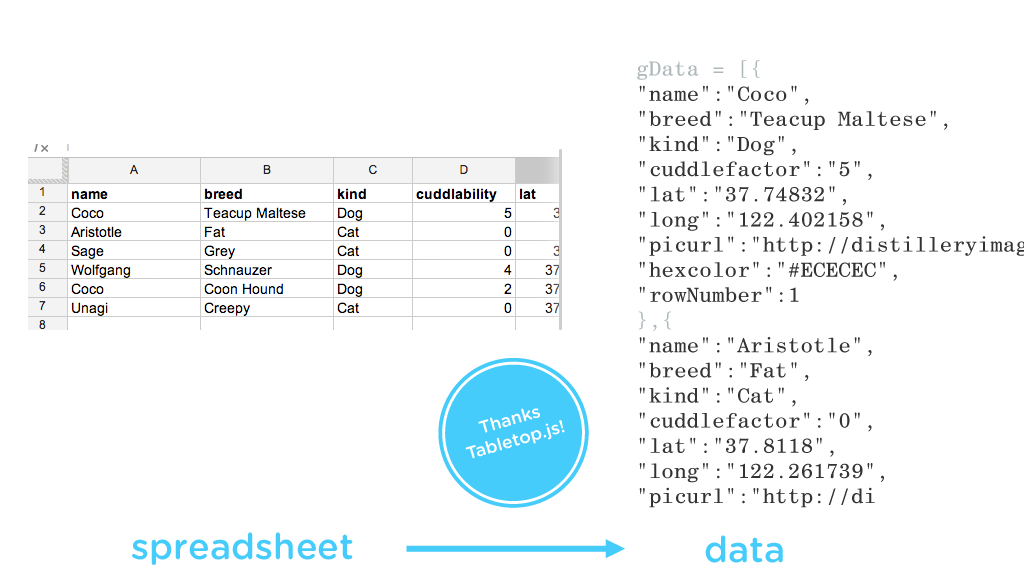
Your Google Spreadsheet should be set up with row one as your column headers. Row two and beyond should be your data. Each header and row becomes an oject in the final array that Tabletop.js delivers of your data.
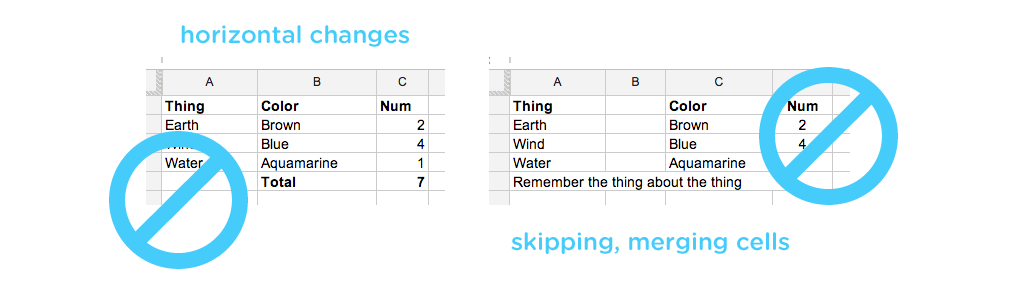
There shouldn't be any breaks or horizontal organization in the spreadsheet. But, feel free to format the style of your spreadsheet as you wish; borders, fonts and colors and such do not transfer or affect your data exporting.
[{"name":"Coco","breed":"Teacup Maltese","kind":"Dog","cuddlability":"5","lat":"37.74832","long":"-122.402158","picurl":"http://distilleryimage8.s3.amazonaws.com/98580826813011e2bbe622000a9f1270_7.jpg","hexcolor":"#ECECEC","rowNumber":1}...]
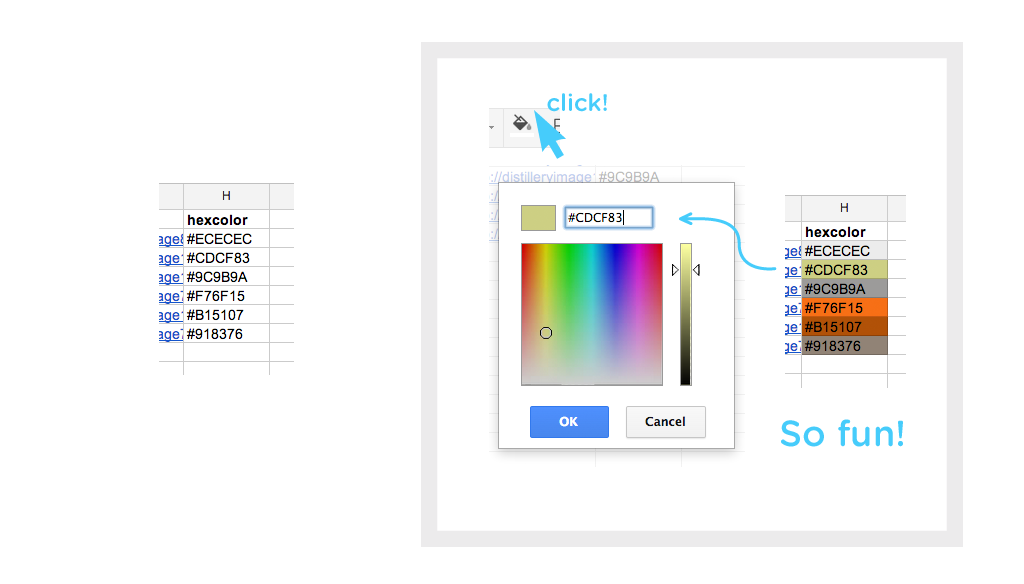
You must add a column to your spreadsheet with the heading hexcolor (case insensitive). The maps, charts and such use colors and this is the easiest way to standardize that. The color scheme is up to you, all you need to do is fill the column with hexidecimal color values. This color picker by Devin Hunt is really nice. #Funtip: Coloring the background of the cell it's hexcolor brings delight!
If you intend to map your data and only have addresses you'll need to geocode the addresses into lat/long coordinates. Mapbox built a plugin that does this for you in Google Docs. You can also use websites like latlong.net to get the coordinates and paste them into rows with column headers lat and long.
image of lat and long column headers
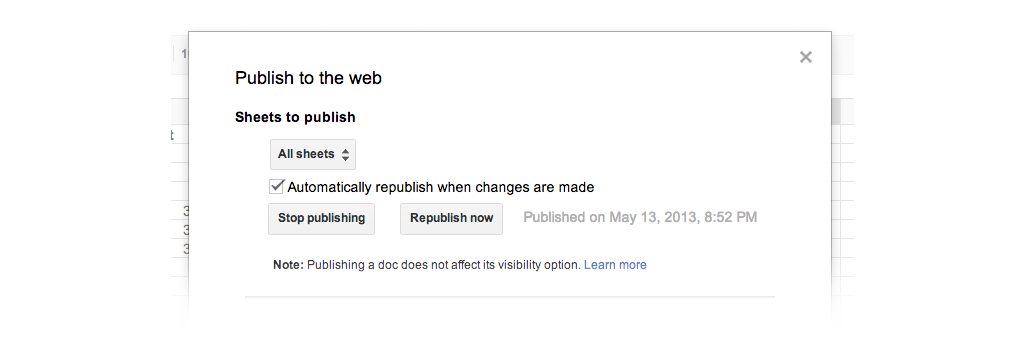
You need to do this in order to generate a unique key for your spreadsheet, which Tabletop.js will use to get your spreadsheet data. In your Google Spreadsheet, click File > Publish to the Web. Then in the next window click Start Publishing; it will then turn into a Stop Publishing button.

You should have an address in a box at the bottom, your key is the portion between the = and the &. You'll retrieve this later when you hook up your site to the spreadsheet.
Before you get started with Sheetsee.js you should plan out your website. Design it, create the basic markup and stylesheet.
For now, create empty div placeholders for the map, chart and tables you plan on including.
Here the paths diverge:
For client-siders, all you need to do is include the depences and sheetsee in your HTML <head> and then in a script tag at the bottom of your page, right before the </body> tag, you'll include this:
<script type="text/javascript">
    document.addEventListener('DOMContentLoaded', function() {
        var gData
        var URL = "0AvFUWxii39gXdFhqZzdTeU5DTWtOdENkQ1Y5bHdqT0E"
        Tabletop.init( { key: URL, callback: showInfo, simpleSheet: true } )
    })
    function showInfo(data) {
        gData = data
        //
        //everything you do with sheetsee goes here
        //
    }
</script>
The URL variable is the key from your spreadsheet's longer URL, explained above. Tabletop.init() takes that URL and execute's Tabletop, when it's done generating the table it executes the callback showInfo function. It's inside of this function that you'll then use your spreadsheet data, gData, to do all the Sheetsee.js goodness with.
The server-side version is in the repo sheetsee-cache. It uses Node.js to go to Google, get the spreadsheet data (with a Node.js version of Tabletop.js, thanks Max Ogden!) and save it on the server. This means every user that visits the page doesn't have to wait on Google's response to load the charts from the data.
When the server builds your page, it will build in your data as the variable gData. All you need to do is add your scripts to the bottom of the page. For the tables/templating you'll need to wrap them in an event listener so that it doesn't try and build them before the data has settled.
<script type="text/javascript">
    document.addEventListener('DOMContentLoaded', function() {
        // table/templating things the rest can be in their own script tags if you'd like
    })
</script>
You can run this locally and it will check your internet connection - if you're not online it will use the last saved data allowing you to develop offline, yay!
Once you clone the repo, navigate there in Terminal, install the node modules and launch the server.
cd sheetsee-cache
npm install
node server.js
This will launch a local server you can visit and develop locally with in your browser.
Tabletop.js will return all of your data and it will be passed into your site as an array of objects called gData. Sheetsee.js has functions built in to help you filter or use that data in other ways if you'd like.
This takes in your data, an array of objects, and searches for a string, keyword, in each piece of your data (formerly the cells of your spreadsheet). It returns an array of each element containing a keyword match. Similarly, using getKeywordCount(data, "keyword) will return the just the number of times the keyword occured.
getKeyword(gData, "cat")
// returns [{breed: "Fat", kind: "cat", hexcolor: "#CDCF83"...}, {breed: "Grey", kind: "cat", hexcolor: "#9C9B9A"...}, {breed: "Creepy", kind: "cat", hexcolor: "#918376"...}]
Given your data, an array of objects and a string column header, this functions sums each cell in that column, so they best be numbers.
getColumnTotal(gData, "cuddlability")
// returns 11
A really simple function that builds on getColumnTotal() by returning the average number in a column of numbers.
getColumnAverage(gData, "cuddlability")
// returns 1.8333333333333333
This will return an array of object or objects (if there is a tie) of the element with the lowest number value in the column you specify from your data.
getMin(gData, "cuddlability")
// returns [{breed: "Fat", cuddlability: "0", hexcolor: "#CDCF83"...}, {breed: "Grey", cuddlability: "0", hexcolor: "#9C9B9A"...}, {breed: "Creepy", cuddlability: "0", hexcolor: "#918376"...}]
This will return an array of object or objects (if there is a tie) of the element with the highest number value in the column you specify from your data.
getMax(gData, "cuddlability")
// returns {breed: "Teacup Maltese", cuddlability: "5", hexcolor: "#ECECEC", kind: "Dog", lat: "37.74832", long: "-122.402158", name: "Coco"...}
Create variables that are the sums, differences, multiples and so forth of others. Lots of info on that here on MDN.
var profit09 = Sheetsee.getColumnTotal(gData, "2009")
var profit10 = Sheetsee.getColumnTotal(gData, "2010")
var difference = profit09 - profit10
You don't have to just create tables of your data. You can have other portions of your page that show things like, "The difference taco consumption between last week and this week is..." These are easy to create with javascirpt math functions and knowing a little bit more about icanhas.js. View source on this page to see how I created "Most Cuddlable".
Takes data as an array of objects, a string you'd like to filter and a string of the category you want it to look in (a column header from your spreadsheet).
getMatches(gData, "dog", "kind")
Returns an array of objects matching the category's filter.
[{"name": "coco", "kind": "dog"...}, {"name": "wolfgang", "kind": "dog"...},{"name": "cooc", "kind": "dog"...} ]
Takes data as an array of objects and a string for category (a column header from your spreadsheet) you want tally how often an element occured.
getOccurance(gData, "kind")
Returns an object with keys and values for each variation of the category and its occurance.
{"dog": 3, "cat": 3}
If you use getOccurance() and want to then chart that data with d3.js, you'll need to make it into an array (instead of an object) and add colors back in (since the hexcolor column applies to the datapoints in your original dataset and not this new dataset).
This function takes in your data, as an object, and an array of hexidecimal color strings which you define.
var kinds = getOccurance(gData, "kind")
var kindColors = ["#ff00ff", "#DCF13C"]

var kindData = makeColorArrayOfObjects(mostPopBreeds, breedColors)
It will return an array of objects formatted to go directly into a d3 chart with the appropriate units and label keys, like so:
[{"label": "dog", "units": 2, "hexcolor": "#ff00ff"}, {"label": "cat", "units": 3, "hexcolor": "#DCF13C"}]
If you pass in an array of just one color it will repeat that color for all items. If you pass fewer colors than data elements it will repeat the sequences of colors for the remainder elements.
If you're using gData, the data directly from Tabletop, you'll need to format it before you use the d3 charts. You'll need to determine what part of your data you want to chart - what will be your label, what your charting, and what will be your units, how many of them are there (this should be a number).
var gData = [{"name": "coco", "kind": "dog", "cuddablity": 5}, {"name": "unagi", "kind": "cat", "cuddlability": 0}]
For istance, if from our original data above we want to chart the age of each cat, we'll use:
Sheetsee.addUnitsLabels(gData, "name", "cuddlability")
Which will return an array, ready for the d3 charts:
[{"label": "coco", "kind": "dog", "units": 5}, {"label": "unagi", "kind": "cat", "units": 0}]
Sheetsee.js uses Mapbox.js, a Leaflet.js plugin, to make maps.
Create an empty <div> in your HTML, with an id.
<div id="map"></div>
Next you'll need to create geoJSON out of your data so that it can be mapped.
This takes in your data and the parts of your data, optionsJSON, that you plan in your map's popups. If you're not going to have popups on your markers, don't worry about it then and just pass in your data.
var optionsJSON = ["name", "breed", "cuddlability"]
var geoJSON = Sheetsee.createGeoJSON(gData, optionsJSON)
It will return an array in the special geoJSON format that map making things love.
[{
  "geometry": {"type": "Point", "coordinates": [long, lat]},
  "properties": {
    "marker-size": "small",
    "marker-color": lineItem.hexcolor
  },
  "opts": {the options you pass in},
}}
To create a simple map, with no data, you simply call `.loadMap() and pass in a string of the mapDiv (with no #) from your HTML.
var map = Sheetsee.loadMap("map")
To add a tile layer, aka a custom map scheme/design/background, you'll use this function which takes in your map and the source of the tileLayer. This source can be a Mapbox id, a URL to a TileJSON or your own generated TileJSON. See Mapbox's Documentation for more information.
Sheetsee.addTileLayer(map, 'examples.map-20v6611k')
You can add tiles from awesome mapmakers like Stamen or create your own in Mapbox's Tilemill or online.
To add makers to your map, use this function and pass in your geoJSON so that it can get the coordinates and your map so that it places the markers there.
var markerLayer = Sheetsee.addMarkerLayer(geoJSON, map)
To customize the marker popup content in your map you'll need to use this entire function on your website.
function addPopups(map, markerLayer) {
  markerLayer.on('click', function(e) {
    var feature = e.layer.feature
    var popupContent = '<h2>' + feature.opts.name + '</h2>' +
                        '<h3>' + feature.opts.breed + '</h3>'
    e.layer.bindPopup(popupContent,{closeButton: false,})
  })
}
You will edit the popupContent variable however you'd like your popups to look. To reference the data you sent to you geoJSON you'll use feature.opts and then one of the column headers you passed into createGeoJSON().
Sheetsee.js supports making multiple tables or templates with IcanHas.js. The tables can have multiple inputs for filtering and table headers can be used to sort the data in that column. For each of these you'll need a <div> in your html, a <script> template and a <script> that calls table functions.
This is as simple as an empty <div> with an id. This id should match the script tempate id in the next section.
<div id="siteTable"></div>
Your template is the mockup of what you'd like your table to look like and what content it should show. Most of this is up to you but if you want users to be able to click on headers and sort that column you must make a table row with table headers with the class tHeader.
The variables inside the {{}} must match the column headers in your spreadsheet. Lowercase (?) and remember spaces are ommited, so "Place Name" will become "placename".
<script id="siteTable" type="text/html">
    <table>
    <tr><th class="tHeader">City</th><th class="tHeader">Place Name</th><th class="tHeader">Year</th><th class="tHeader">Image</th></tr>
      {{#rows}}
        <tr><td>{{city}}</td><td>{{placename}}</td><td>{{year}}</td><td>{{image}}</td></tr>
      {{/rows}}
  </table>
</script>
<script type="text/javascript">
    document.addEventListener('DOMContentLoaded', function() { // IE6 doesn't do DOMContentLoaded
        Sheetsee.makeTable(gData, "#siteTable")
        Sheetsee.initiateTableFilter(gData, "#tableFilter", "#siteTable")
    })
</script>
To create another table, simply repeat the steps.
<div id="secondTable"></div>
<script id="secondTable"> // your table template here </script>
<script>
  Sheetsee.makeTable(otherData, "#secondTable")
  Sheetsee.initiateTableFilter(otherData, "#secondFilter", "#secondTable")
</script>
Learn more about the things you can do with mustache.js.
You'll call this to make a table out of a data and tell it what targetDiv in the html to render it in (this should also be the same id as your script template id).
Sheetsee.makeTable(gData, "#siteTable")
If you want to have an input to allow users to search/filter the data in the table, you'll add this to your html:
<input id="tableFilter" type="text" placeholder="filter by.."></input>
<span class="clear button">Clear</span>
<span class="noMatches">no matches</span>
You will then call this function to make that input live:
Sheetsee.initiateTableFilter(gData, "#TableFilter", "#siteTable")
Sheetsee.js comes with a d3.js bar, pie and line chart. Each requires your data be an array of objects, formatted to contain "label" and "units" keys. See the section above on Your Data to learn about formatting.
You'll have to experiement with the charts to find the correct size your <div> will need to be to hold the chart with your data in it nicely.
You can also make your own d3 chart in a separate .js file, link to that and pass your data on to it. I'd love to see people building some other charts that will work with Sheetsee.
To create a bar chart you'll need to add a placeholder <div> in your HTML with an id.
<div id="barChart"></div>
In your CSS, give it dimensions.
#barChart {height: 400px; max-width: 600px; background: #F8CDCD;}
In a <script> tag set up your options.
var barOptions = {m: [60, 60, 30, 150], w: 600, h: 400, div: "#barChart", xaxis: "no. of pennies", hiColor: "#FF317D"}
- m is margins: top, right, bottom, left
- w and h are width and height, this should match your CSS specs
- div is the id for the
<div>in your HTML - xaxis is optional text label for your x axis
- hiColor is the highlight color of your choosing!
Then call the d3BarChart() function with your data and options.
Sheetsee.d3BarChart(data, barOptions)
To create a line chart you'll need to add a placeholder <div> in your html with an id.
<div id="lineChart"></div>
In your CSS, give it dimensions.
#lineChart {height: 400px; max-width: 600px; background: #F8CDCD;}
In a <script> tag set up your options.
var lineOptions = {m: [80, 100, 120, 100], w: 600, h: 400, div: "#lineChart", yaxis: "no. of pennies", hiColor: "#14ECC8"}
- m is your margins: top, right, bottom, left
- w and h are width and height, this should match your CSS specs
- div is the id for the
<div>in your HTML - yaxis is optional text label for your y axis
- hiColor is the highlight color of your choosing!
Then call the d3LineChart() function with your data and options.
Sheetsee.d3LineChart(data, lineOptions)
To create a bar chart you'll need to add a placeholder <div> in your html with an id.
<div id="pieChart"></div>
In your CSS, give it dimensions.
#pieChart {height: 400px; max-width: 600px; background: #F8CDCD;}
In a <script> tag set up your options.
var pieOptions = {m: [80, 80, 80, 80], w: 600, h: 400, div: "#pieChart", hiColor: "#14ECC8"}
- m is your margins: top, right, bottom, left
- w and h are width and height, this should match your CSS specs
- div is the id for the
<div>in your HTML - hiColor is the highlight color of your choosing!
Then call the d3PieChart() function with your data and options.
Sheetsee.d3PieChart(data, pieOptions)
Thanks to Code for America for providing the platform me to build the first version of sheetsee.js for Macon, Georga.
Thanks to Dan Sinker at Open News for having faith and getting things together to make this Code Sprint happen and thanks to Matt Green at WBEZ for being a willing partner.
Thanks to Max Ogden for emotional support, teaching me JavaScript and working on the harder parts of Sheetsee.js - especially for making Tabletop.js for Node.js.
Thanks to all the authors and contributors to Tabletop.js, Mapbox.js, Leaflet.js, jQuery, ICanHas.js and d3.js. Thanks to Google and the Internet for existing and to all those who've written tutorials or asked or answered a question on StackOverflow.
Thanks to Mom and Dad for getting a computer in 1996 and the mIRC scripts I started writing that I suppose would eventually lead me here.