Intel® Xeon® Scalable Processors UNCORE accelerator(start from 4th Gen Intel® Xeon® Scalable Processor (codenamed Sapphire Rapids)) including Intel® In-Memory Analytics Accelerator (Intel® IAA), Intel® Data Streaming Accelerator (Intel® DSA) and Intel® QuickAssist Technology (Intel® QAT), etc are key feature of Intel® Xeon® Scalable Processors that can benefit the Intel architecture platform performance in the data center industry.
The accelerator and related software stack can be a key contributor to data center system performance, but sometimes it’s NOT easy for customer/user to get/understand the performance data of the accelerator like utilization, throughput, etc since low level hardware event sets is complex to understand without the deep knowledge of the accelerator hardware/software architecture.
This pcm-accel tool will sample the performance data from accelerator hardware and show it to end user in an easy-to-understanding format.
The goal is to help the user to quickly and accurately see a high-level performance picture or identify issues related to accelerator with or without solid knowledge of it.
pcm-accel [target] [options]
Notes: only 1 target is allowed to monitor.
| target | Default | Description |
|---|---|---|
| -iaa | yes | Monitor the IAA accelerator. |
| -dsa | no | Monitor the DSA accelerator. |
| -qat | no | Monitor the QAT accelerator. |
Notes: multiple options is allowed.
| options | Default | Description |
|---|---|---|
| -numa | no | Print NUMA node mapping instead of CPU socket location. |
| -evt=[cfg.txt] | opCode-xxx-accel.txt | Specify the event config file name as cfg.txt. - xxx is the cpu model id, for example 143 for sapphire rapid. |
| -silent | no | Silence information output and print only measurements |
| -csv[=file.csv] | no | Output compact CSV format to screen or a file in case filename is provided |
| -csv-delimiter=[value] | no | Set custom csv delimiter |
| -human-readable | no | Use human readable format for output (for csv only) |
| -i=[value] | 0 | Allow to determine number of iterations, default is 0(infinite loop) if not specified. |
| [interval] | 3 | Time interval in seconds (floating point number is accepted) to sample performance counters, default is 3s if not specified. |
This example prints IAA counters every second 10 times and exits
pcm-accel -iaa 1.0 -i=10
This example saves IAA counters twice a second save IAA counter values to test.log in CSV format
pcm-accel -iaa 0.5 -csv=test.log
This example prints IAA counters every 3 second in human-readable CSV format
pcm-accel -iaa -csv -human-readable
Linux* OS:
FreeBSD* OS:
Windows OS:
- Install and load the required accelerator driver(iaa/dsa, qat driver, etc).
Notes:
- QAT monitoring and NUMA node display feature is supported only on Linux OS!
Common indicator(Column field):
- Accelerator = Accelerator device id.
- Socket = CPU socket id where accelerator device is located.
- NUMA Node = NUMA node that accelerator device belongs to.
- Inbound_BW = Data throughput input to the accelerator device, unit is Bps(Bytes per second).
- Outbound_BW = Data throughput output from the accelerator device, unit is Bps(Bytes per second).
Specific indicators related to IAA/DSA:
- ShareWQ_ReqNb = The number of request submitted to share work queue of accelerator.
- DedicateWQ_ReqNb = The number of request submitted to dedicate work queue of accelerator.


Specific indicators related to QAT:
-
util_comp0 = The utilization of the compress engine 0, unit is %.(Sapphire Rapids platform has 1 compress and 3 decompress engine per QAT device)
-
util_decomp0 = same as above for decompress engine 0.
-
util_decomp1 = same as above for decompress engine 1.
-
util_decomp2 = same as above for decompress engine 2.
-
util_xlt0 = same as above for translation engine 0.

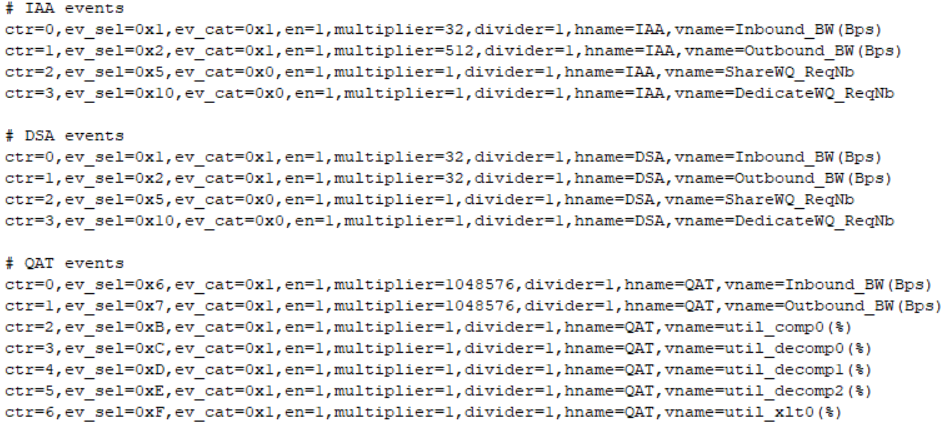
pcm-accel tool allows the user to customized the monitored performance events with the config file as advance feature.
Customize fields of cfg file:
- ev_sel and ev_cat field for IAA/DSA monitor event.
- ev_sel field for QAT monitor event.
- multiplier/divider is for event data display calculation.
- vname is the event name string(column) displayed in the UI.
Please refer to the spec or code to learn more about the event mapping if you want to customize it.
-
QAT: please refer to the mapping table in source code
Here is the content of the event cfg file(opCode-143-accel.txt as example)