As of version 2.1.0 we have added new features for rendering heatmaps. Heatmaps make it easy for viewers to understand the distribution and relative intensity of data points on a map. Rather than placing a marker at each location, heatmaps use color to represent the distribution of the data.
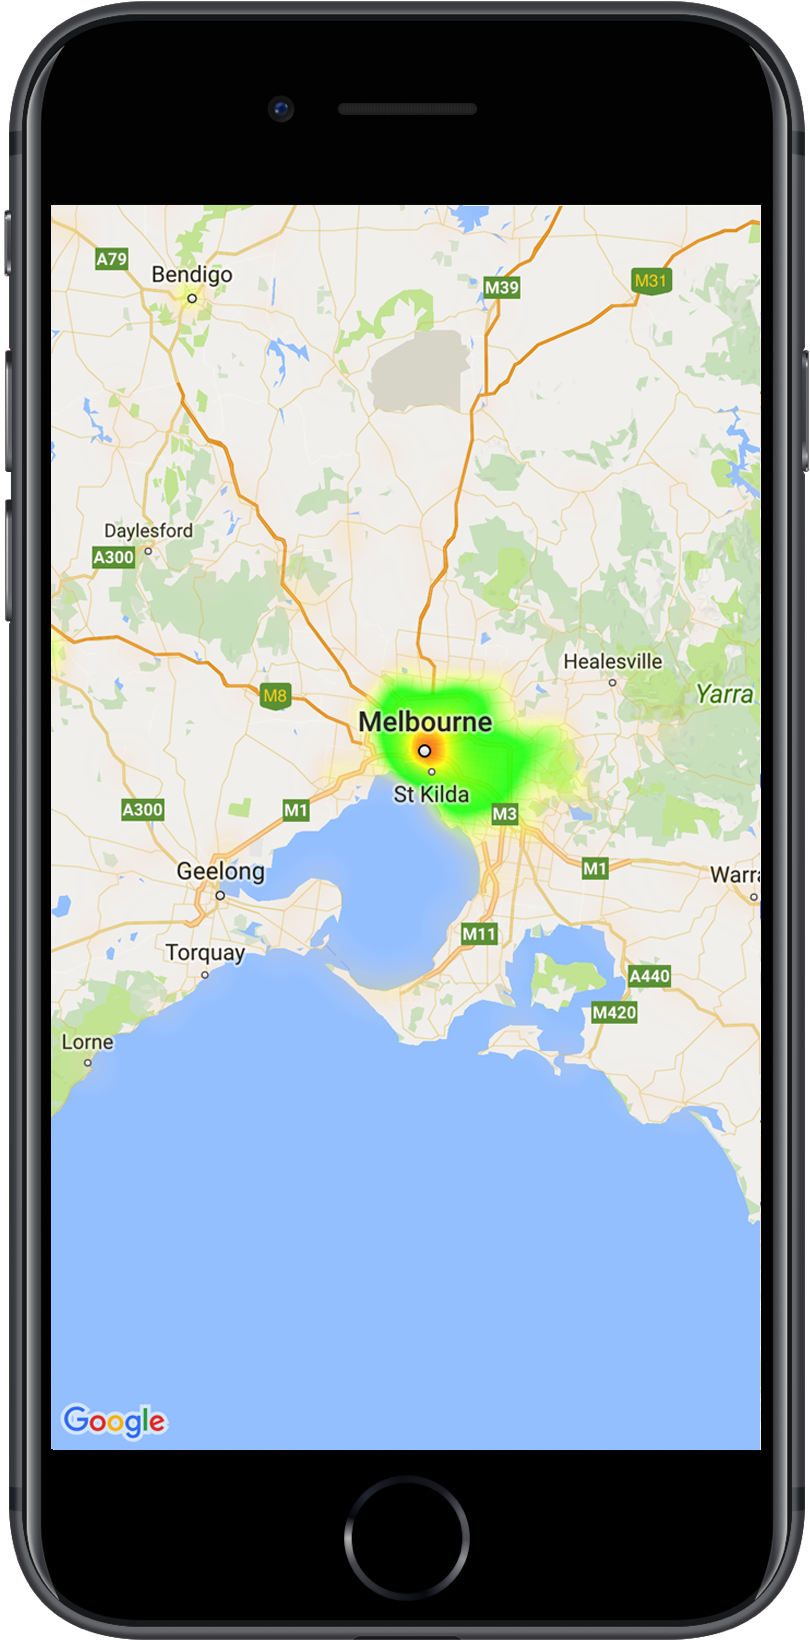
In the example below, red represents areas of high concentration of police stations in Victoria, Australia.
Heatmap interpolation allows developers to create robust heatmaps based on average intensities of given data points. The heatmap interpolation class also allows developers with sparse data sets to produce meaningful heatmaps. Developers can input lists of GMUWeightedLatLng objects (or singular) and the class's point generating function will return an array of GMUWeightedLatLng that can be added to the existing heatmap.
Please use this link to test out the heat map interpolation algorithm!
In the following image, the data set consists of only four points (indicated by markers); the second-top point is the most intense in the given data set. Every other heat map point in the graph was interpolated.
