Issue with "autorange_after_scroll" when using an arbitrary function #279
Labels
bug
Something isn't working
Comments
Sign up for free
to join this conversation on GitHub.
Already have an account?
Sign in to comment
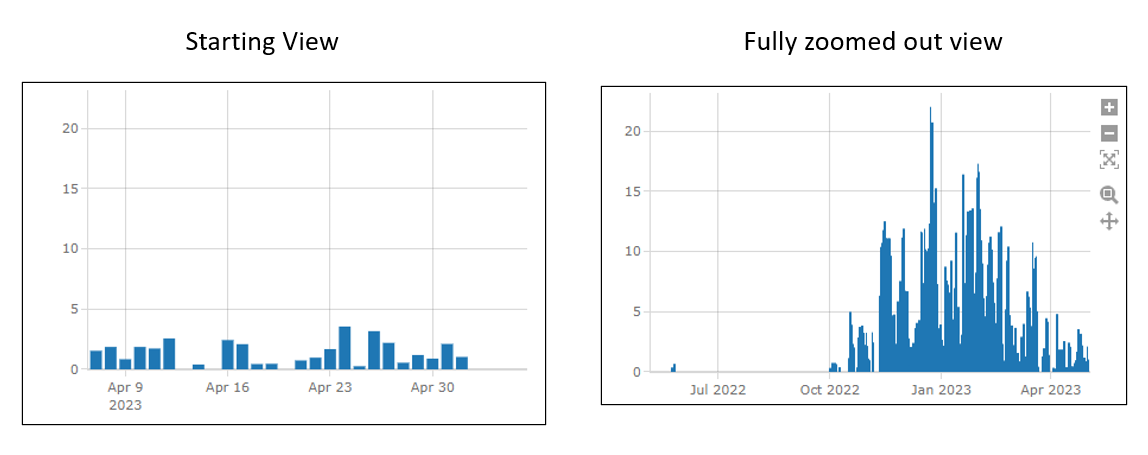
The "autorange_after_scroll" function does not seem to work correctly when I use an arbitrary function to define different X and Y values (put new values into xs and ys. It scales the largest Y axis to the largest Y value in the data.
If I only change the return xs and ys to return the orginal xs and ys and nothing else, it seems to work fine. So maybe there is something wrong with the data I am passing, but it seems to display fine and I can't see a difference when I debug.
Displayed Graphs
Debug Data

The text was updated successfully, but these errors were encountered: