
- Name
joystick
- Website
- Author
Guillaume Schworer
- Version
0.3
Joystick provides a light-weight and simple framework to real-time data-plotting and logging, while the console remains accessible to manage the on-going simulation and data acquisition.
In some ways, this framework can replace a Graphical User Interface (GUI) on many projects, as long as 1) the user is comfortable enough with managing the simulation using command-lines, and 2) the display of the real-time data is not too complex.
Allright. Let's say you have some data-stream (serial port, web scraping, on-going simulation or experiment, etc), and you would like to plot or log in real-time whatever is happening. In addition you would also like to send commands to interact with the mechanisms producing the data... without having to build a GUI (which looks pretty to your boss, but is time-consumming both in initial design and maintenance).
Then, this package is for you.
Note that Joystick is based on Tkinter to display frames of text or graph, and that it is released under the GNU General Public License v3 or later (GPLv3+).
Straight to the point: check-out this example. It generates fake random data (ydata) between 0 and 1.05 every 0.2 second, displayed as a function of time in a graph-frame. Whenever there is a datapoint above 1, it drops a warning in the text-frame.
import joystick as jk
import numpy as np
import time

class test(jk.Joystick):
    # initialize the infinite loop and callit decorators so they can auto-
    # register methods they decorate
    _infinite_loop = jk.deco_infinite_loop()
    _callit = jk.deco_callit()

    @_callit('before', 'init')
    def _init_data(self, *args, **kwargs):
        # Function automatically called at initialization, thanks to the
        # decorator
        self.xdata = np.array([])  # time x-axis
        self.ydata = np.array([])  # fake data y-axis

    @_callit('after', 'init')
    def _build_frames(self, *args, **kwargs):
        # Function automatically called at initialization, thanks to the
        # decorator. It will be called after "_init_data" given that it is
        # declared after
        # create a graph frame
        self.mygraph = self.add_frame(
                   jk.Graph(name="test", size=(500, 500), pos=(50, 50),
                            fmt="go-", xnpts=15, freq_up=7, bgcol="y",
                            xylim=(0,10,0,1), xlabel='t', ylabel='random'))
        # create a text frame
        self.mytext = self.add_frame(
                      jk.Text(name="Y-overflow", size=(500, 250),
                              pos=(600, 50), freq_up=1))

    @_callit('before', 'start')
    def _set_t0(self):
        # initialize t0 at start-up
        self._t0 = time.time()

    @_infinite_loop(wait_time=0.2)
    def _get_data(self):
        # This method will automatically be called with simulation start
        # (t.start()), and looped every 0.2 in a separate thread as long as
        # the simulation runs (running == True)
        # It gets new data (fake random data) and pushes it to the frames.
        # concatenate data on the time x-axis
        new_x_data = time.time()
        self.xdata = jk.core.add_datapoint(self.xdata,
                                           new_x_data,
                                           xnptsmax=self.mygraph.xnptsmax)
        # concatenate data on the fake data y-axis
        new_y_data = np.random.random()*1.05
        # check overflow for the new data point
        if new_y_data > 1:
            # send warning to the text-frame
            self.mytext.add_text('Some data bumped into the ceiling: '
                                 '{:.3f}'.format(new_y_data))
        self.ydata = jk.core.add_datapoint(self.ydata,
                                           new_y_data,
                                           xnptsmax=self.mygraph.xnptsmax)
        # prepare the time axis
        t = np.round(self.xdata-self._t0, 1)
        # push new data to the graph
        self.mygraph.set_xydata(t, self.ydata)

    @_callit('before', 'exit')
    def exit_warning(self):
        # Just a warning, automatically called with the exit method, and
        # before the exiting actually takes place (closing frames, etc)
        print("You're about to exit, frames will disappear in 1 second")
        time.sleep(1)

t = test()
t.start()
Here is what it should look like:
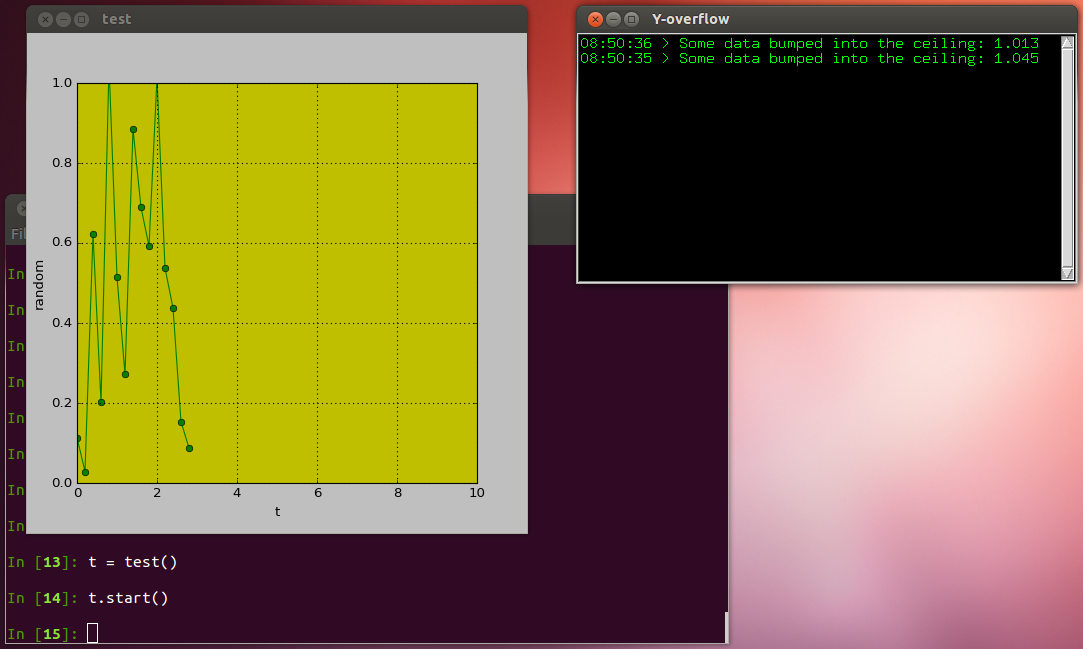
You should see a 'snake' going through the graph-frame, but after 10 seconds it is gone (that was on purpose, for the sake of the demo!). Type (line by line):
t.mygraph.xnpts = 50
t.mygraph.freq_up = 2
t.mygraph.xylim = (None, None, 0, 1)
Now that should be better, displaying the latest 50 points at a slower pace (twice a second), and the x-axis is auto-adjusting. Let's stop and reinitialize the graph with slightly different parameters:
t.stop()
t.mygraph.reinit(bgcol='w', axrect=(0,0,1,1), xylim=(None, None, 0, 1))
t.start()
t.stop()
t.exit()
Too easy!
Note that this is a quick overview of the main point of this package. Other frames than simple text or graph are available: image, multi-line graph, 2D+color scatter graph, etc. Checkout the example.py for further details.
Refer to this page, http://pythonhosted.org/joystick/joystick.html
Joystick requires the following Python packages:
- tkinter: for the frames GUI
- NumPy: for basic numerical routines
- matplotlib: for plotting
- threading, time, functools, os: for basic stuff
The easiest and fastest way for you to get the package and run is to install joystick through pip:
$ pip install joystickYou can also download joystick source from GitHub and type:
$ python setup.py installDependencies will not be installed automatically. Refer to the requirements section. If you have an anaconda distribution, you will be good to go.
Code contributions are welcome! Just send a pull request on GitHub and we will discuss it. In the issue tracker you may find pending tasks.
If you think you've found one please refer to the issue tracker on GitHub.
You can either send me an e-mail or add it to the issues/wishes list on GitHub.
If you use joystick on your project, please drop me a line <mailto:{my first name}.{my family name}@gmail.com>, you will get fixes and additional options earlier.
Joystick is released under the GNU General Public License v3 or later (GPLv3+). Please refer to the LICENSE file.