This project is now nearly five years old. Huzzah! It is also slowly falling out of date. Many of the ideas in it are still relevant but vector tile technology has improved significantly since I did this work. I think the tutorial is still useful, but be aware there are more modern choices for things. For example, I'd use the Mapbox vector tiles format for the tiles now, not GeoJSON.
Also the code may have rotted a little bit. The main thing that breaks is the download URLs for NHD become invalid. It's easy to update them (typically a version number increment). Pull requests welcome.
By Nelson Minar <nelson@monkey.org>
May 2013
See the live map
and the source code.
Many thanks to Mike Bostock, Seth Fitzsimmons, Mike Migurski, and Bobby Sudekum for feedback and help.
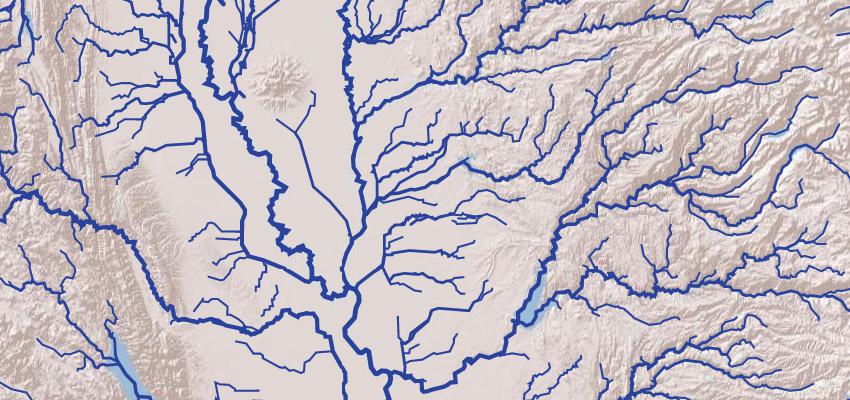
This project contains everything you need from start to finish to make a vector based web map of American rivers in the contiguous 48 states. This demonstration map is neither particularly beautiful nor complex, but it is a complete example of how to build a web map using tiled vector data into a web map. The source code is open source you are encouraged to read and tinker with. There are three parts to the project: data preparation, HTTP serving of vector tiles, and clients that render maps. The components integrated in this project are:
- NHDPlus, the source data for river flowlines.
- PostGIS, a geographic database.
- TileStache, a vector tile GeoJSON server.
- Gunicorn, a Python web server container.
- Leaflet, Polymaps, and D3.js, three Javascript libraries for rendering maps.
It's a lot of pieces, but each one is pretty simple by itself. Combined together they form a powerful open source mapping stack for serving vector data to web browsers. You're welcome to see the map running live on my server, but the real point of this project is to show developers all the pieces necessary to build their own map using vector tiles. Read on for details of how the map is constructed and be sure to check out the source code; lots of comments and a focus on readability. There are also some very detailed development notes on my work journal.
For client authors, the vector tiles are available as a service with
the URL pattern
http://somebits.com:8001/rivers/{z}/{x}/{y}.json.
Light use only please; the server is not provisioned for real traffic.
- Install required software.
- Run
dataprep/downloadNhd.shto download data to a directory named "NHD". - Run
dataprep/importNhd.shto bring data NHD into a PostGIS database named "rivers". - Run
serve.shfrom inside theserverdirectory to start TileStache in Gunicorn at http://localhost:8000/. - Load a sample tile on localhost to verify GeoJSON tiles are being served.
- Run
clients/serverTest.pyto do a quick test on the server. - Load
clients/rivers-leaflet.html,clients/rivers-polymaps.html,clients/rivers-d3.html, orclients/rivers-d3leaflet.htmlto view the map.
Vector tiles are an exciting, underutilized idea to make efficient maps. Google Maps revolutioned online cartography with "slippy maps", raster maps that are a mosaïcof PNG or JPG images. But a lot of geographic data is intrinsically vector oriented, lines and polygons. Today many map servers render vector data into raster images that are then served to clients. But serving the vector data directly to the user's browser for rendering on the client can make maps that are more flexible and more efficient. Mobile apps and proprietary services like Google Maps are starting to switch to vector maps.
Open source vector mapping is still in the early stages. There are several open source vector clients: Polymaps was an early pioneer for browser maps, MapsForge and OpenScienceMap are renderers for Android, and MapBox 2 is based on a vector tile stack. There are few open data vector services although recently OpenStreetMap has experimented with serving vector tiles. (See experimental clients like Ziggy Jonsson's, Bobby Sudekum's, and Mike Bostock's.) And currently there are only a couple of open source vector tile servers. This tutorial relies on TileStache's VecTiles provider to serve our geodata. Ceramic is an alternative.
Tiling isn't necessary for all vector data; if the full dataset is small it is reasonable to serve an entire vector geometry as a single file. For example, this tutorial maps incldues an 88kb file of US state outlines. But with 10+MB of geodata it's important to only serve visible geometry, not the entire dataset. In addition scaling tiles to the current zoom level allows simplification and down-sampling to pixel visibility. But tiling requires a lot of data preparation and server setup, hence this tutorial.
Vector tiles are ultimately quite simple. Consider this tile near near Oakland (cached copy in sample-13-1316-3169.json.txt). The URL naming system is Google's convention for raster map tiles: this tile is at z=13, x=1316, y=3169. Only instead of serving a PNG image the URL serves a GeoJSON file describing the geometry inside the tile's bounding box. This example tile has 3 features in it; one for San Lorenzo Creek, one for Sulphur Creek, and one for two other unnamed flows in the tile. Each feature contains a geometry, a name, a HUC code naming the watershed, and a Strahler number characterizing the river's significance.
One tricky thing about vector tiles is what to do about features that cross tiles. In this tutorial we clip the geometry to the tile boundary and rely on the overlapping lines being drawn to make a seamless map. It's also possible to not clip, which results in redundant data but keeps features intact. A third option can be to clip geometry and re-unify it on the client before rendering.
The following is a partial list of software you need installed on your Unix
system to generate and serve these maps. (Sorry Windows users, Unix is a
better choice for this kind of work.) I've tested with both MacOS and Ubuntu.
On the Mac, most prerequisites are available via
Homebrew; see also this
guide to open source geo on the Mac.
On Ubuntu most software is available via
apt-get. This code requires PostGIS 2; if you are running something older than Ubuntu 14.04 you
may need the UbuntuGIS
PPA. See below for
extra Ubuntu notes. Other Linux
distributions can probably install the required software via their native
package system. If the code is available on
PyPI I prefer to install Python code with
[pip](http://www.pip- installer.org/en/latest/) rather than rely on the Mac
or Ubuntu package versions.
- Python 2. I'd prefer Python 3 but some of the dependencies don't support it.
- curl for downloading NHDPlus data from the web.
- p7zip for unpacking NHDPlus data. Ubuntu users be sure to install
p7zip-full. - PostgreSQL and PostGIS for a geospatial database. PostgreSQL 9.1 or later and PostGIS 2 are recommended for ease of installing the PostGIS extension. This database is moderately large; you may want to tune Postgres settings to use more memory.
- psycopg2 for talking to Postgres from Python.
- shp2pgsql, part of PostGIS, for importing ESRI shapefiles into PostGIS
- pgdbf for importing DBF databases into PostgreSQL. Note you need at least version 0.6.2 for the
-sflag. - Gunicorn for a Python web app server.
- TileStache for the Python web app that serves map tiles. TileStache has
an undocumented dependency on Shapely
that you can install via
pip. - requests and
grequests for
serverTest.py, a Python HTTP client test. - gdal is the low level library for open source geo.
Not quite a complete cookbook, but close:
# Install needed software with apt and PIP
apt-get install git p7zip-full python-pip postgresql-server-dev-all python-dev libevent-dev gdal-bin postgis postgresql-client postgresql pgdbf
_create a virtualenv for python 2_
pip install psycopg2 gunicorn tilestache mapbox-vector-tile==0.5.0 requests grequests shapely --allow-external PIL --allow-unverified PIL

# Ensure postgres allows you to connect without a password
echo 'select version();' | psql -w -U nelson -h localhost postgres
# If this fails, configure postgres to let you connect via TCP to localhost without password
# One option is to specify the "trust" method on 127.0.0.1/32
edit /etc/postgresql/9.5/main/pg_hba.conf

# Optionally tune postgres performance
edit /etc/postgresql/9.5/main/postgresql.conf
This project consists of several short scripts and configuration files to glue together the software components. There is precious little programming logic here, most of it is integration.
-
dataprep/downloadNhd.shdownloads data from [NHDPlus](http://www.horizon- systems.com/nhdplus/), a nice repository of cleaned up National Hydrographic Data distributed as ESRI shapefiles. This shell script takes care of downloading the files and then extracting the specific data files we're interested in. NHDPlus is a fantastic resource if you're interested in mapping water in the United States. Note by default the script only downloads data for California; edit the script if you want the entire US. -
dataprep/importNhd.shimports the NHDPlus data into PostGIS and prepares it for serving. This script borrows ideas from Seth Fitzsimmons' NHD importer. Note that detailed output is logged to a file named/tmp/nhd.log.*, see the first line of script output for details. The steps this script takes are:- Create a database named
rivers
- Create a database named
-
dataprep/processNhd.sqlprepares the imported data to a format more tailored to our needs. It makes a new table namedriverswhich joins the geometry from NHDFlowline with metadata such as river name, reach code, and Strahler number from PlusFlowlineVAA. It has about 2.7 million rows for the whole US. (NHDFlowline has nearly 3 million rows; flowlines which have no comid in PlusFlowlineVAA are discarded.) -
dataprep/mergeRivers.pyoptimizes the data by merging geometry. NHD data has many tiny little rows for a single river. For efficiency we merge geometries based on river ID and the HUC8 portion of the reach code. The resultingmerged_riverstable has about 330,000 rows. This step is complex and not strictly necessary — TileStache can serve the geometry in theriverstable directly. But the resulting GeoJSON is large and slow to render; merging each river into a single LineString or MultiLineString results in vector tiles roughly one tenth the size and time to process. -
server/serve.shis a simple shell script to invoke Gunicorn and the TileStache webapp and serve it at http://localhost:8000/. In a real production deployment this should be replaced with a server management framework. (It's also possible to serve TileStache via CGI, but it's terribly slow.) -
server/gunicorn.cfg.pyis the Gunicorn server configuration. There's very little here in this example, Gunicorn has many configuration options. -
server/tilestache.cfgsets up TileStache to serve a single layer namedriversfrom themerged_riverstable, backed by a cache in/tmp/stache. It uses the VecTiles provider, the magic in TileStache that takes care of doing PostGIS queries and preparing nicely cropped GeoJSON tiles. At this layer we start making significant cartographic decisions. -
clients/serverTest.pyis a simple Python client test that inspects a few vector tiles for basic correctness and reports load times.clients/slowTiles.pyis another simple test client for timing a few particularly slow tiles for the larger US data set. -
clients/rivers-leaflet.html,clients/rivers-polymaps.html,clients/rivers-d3.html, andclients/rivers-d3leaflet.htmlare four different implementations of Javascript map renderers. They each load vector tiles from URLs likehttp://localhost:8000/rivers/{z}/{x}/{y}.jsonand render them as SVG. Most versions also load a couple of other map layers for context: a shaded relief map from ESRI and vector outlines of US states.
The differences between these clients are which Javascript libraries are used to implement the map. Leaflet is an actively maintained excellent Javascript map library;rivers-leafletuses vector tile support from Glen Robertson's leaflet-tilelayer-geojson plugin, whereasrivers-d3leafletuses a Leaflet/D3 hybrid that is fast but not feature complete. Polymaps is an older Javascript map library that is no longer actively maintained. Polymaps pioneered the vector tile idea and renders vector maps very efficiently. D3.js is a visualization toolkit with strong geographic data capabilities. The D3 implementation is more of a demo than a complete map and is heavily borrowed from an example by Mike Bostock.
Most of the work in this project is plumbing, systems programming we have to do to make the engines go. The demonstration map is deliberately quite simple and unsophisticated. Even so, it contains a few decisions requiring the map maker's art.
Most of the actual cartography is being done in Javascript, in the Leaflet and Polymaps drawing scripts. This tutorial code does very little, mostly just drawing blue lines in varying thicknesses. In addition the Leaflet version has a simple popup when rivers are clicked. With the actual vector geometry and metadata available in Javascript a lot more could be done in the presentation; highlighting rivers, interactive filtering by Strahler number, combination with other vector data sources, etc.
The map clients presented here all use the Google Mercator projection, as is standard for web maps. But because the river data is vector oriented it's possible to project it in other ways. For example, see Jason Davies' Albers rivers map.
Some cartographic decisions are made on the server side. The TileStache VecTiles configuration contains an array of queries that return results at different zoom levels. At high zoom levels (say z=4) we only return rivers which are relatively big, those with a Strahler number of 6 or higher. At finer grained zoom levels we return more and smaller rivers. This per-zoom filtering both limits the bandwidth used on large scale maps and prevents the display from being overcluttered. Rendering zillions of tiny streams can be quite beautiful, but also resource intensive.
VecTiles also simplifies the geometry, serving only the precision needed at the zoom level. You can see this in action if you watch it re-render as you navigate; rivers will start to grow more bends and detail as you zoom in. TileStache does that for us automatically.
The map provided here is a simple tutorial demonstration. To make this a better map, some possible directions:
-
More beautiful river rendering. The rivers here are drawn as simple blue lines with a thickness based on the zoom level and the river's Strahler number, a topological measure of its distance from headwaters. The map could be made more beautiful by varying the river color too, or bringing in extra information on river size such as flow rate or average channel width. See this Pacific Institute map for an example using flow estimates from NHD's EROM_MA0001 table.
-
More thematic data. The ESRI relief tiles are a nice base map because they show the natural relationship between terrain and river flow, but it's pretty minimal. Why not add some ponds and lakes, or ground cover coloring, or cities and major roads?
-
Use a better HTTP server. Gunicorn is designed to run behind a proxy like Nginx or Apache. Not only does a proxy handle slow clients better, it can serve appropriate caching headers and gzip the JSON output. The file
server/nginx-rivers.confis how the tiles are served on the live server. -
More efficient vector tiles. The code here downloads a new set of tiles for every zoom level. But that's needlessly redundant; it's feasible to only download new tiles every few zoom levels and trade off pixel-perfect accuracy for smaller bandwidth.
-
Convert to TopoJSON for smaller encoding. Even without shared topology TopoJSON encoding can be significantly smaller than equivalent GeoJSON. See Mike Bostock's experiments converting the entire river network to one giant TopoJSON file.
-
Measure and improve client render time. The D3 version of the client shows that rendering can happen very fast. Unfortunately Leaflet's GeoJSON rendering is pretty slow and Polymaps somewhere in the middle. Some quality time with Chrome Developer Tools could help figure out where to optimize Leaflet, or maybe the
lib/TileLayer.d3_geoJSON.jslibrary could be extended to support all the features of a Leaflet tile layer. -
WebGL or Canvas clients. All three Javascript clients in this tutorial render via SVG. That's a natural choice for vector data but it can be slow, particularly on mobile browsers. WebGL is a very interesting option; see Migurski's experiments with WebGL and vector maps.
-
Alternate projections. The spherical mercator we use for web maps is a reasonable compromise, but other projections can be interesting. See Jason Davies' Albers rivers map, Jason's canvas raster reprojection, and Mike Bostock's WebGL raster reprojection.
-
Extend data coverage to Alaska, Hawaiʻi, and other countries. Natural Earth is a good place to start. It also has links to other sources like Europe's CCM2. Australia has data too!
The vector river map lays out all the components required to make an open source vector map, from downloading the data to preparing it in a database to serving tiles on the Web to rendering those tiles in the browser. If this tutorial was helpful to you or you have any suggestions or questions, please feel free to email the author at nelson@monkey.org. I'm looking forward to seeing what others are inspired to do!