Lighthouse applies network throttling to emulate the ~85th percentile mobile connection speed even when run on much faster fiber connections.
This is the standard recommendation for mobile throttling:
- Latency: 150ms
- Throughput: 1.6Mbps down / 750 Kbps up.
- Packet loss: none.
These exact figures are defined in the Lighthouse constants and used as Lighthouse's throttling default. They represent roughly the bottom 25% of 4G connections and top 25% of 3G connections (in Lighthouse this configuration is currently called "Slow 4G" but used to be labeled as "Fast 3G"). This preset is identical to the WebPageTest's "Mobile 3G - Fast" and, due to a lower latency, slightly faster for some pages than the WebPageTest "4G" preset.
Within web performance testing, there are four typical styles of network throttling:
- Simulated throttling, which Lighthouse uses by default, uses a simulation of a page load, based on the data observed in the initial unthrottled load. This approach makes it both very fast and deterministic. However, due to the imperfect nature of predicting alternate execution paths, there is inherent inaccuracy that is summarized in this doc: Lighthouse Metric Variability and Accuracy. The TLDR: while it's roughly as accurate or better than DevTools throttling for most sites, it suffers from edge cases and a deep investigation to performance should use Packet-level throttling tools.
- Request-level throttling , also referred to as DevTools throttling in the Lighthouse panel or
devtoolsthrottling in Lighthouse configuration, is how throttling is implemented with Chrome DevTools. In real mobile connectivity, latency affects things at the packet level rather than the request level. As a result, this throttling isn't highly accurate. It also has a few more downsides that are summarized in Network Throttling & Chrome - status. The TLDR: while it's a decent approximation, it's not a sufficient model of a slow connection. The multipliers used in Lighthouse attempt to correct for the differences. - Proxy-level throttling tools do not affect UDP data, so they're decent, but not ideal.
- Packet-level throttling tools are able to make the most accurate network simulation. While this approach can model real network conditions most effectively, it also can introduce more variance than request-level or simulated throttling. WebPageTest uses packet-level throttling.
Lighthouse, by default, uses simulated throttling as it provides both quick evaluation and minimized variance. However, some may want to experiment with more accurate throttling... Learn more about these throttling types and how they behave in in different scenarios.
The Lighthouse panel has a simplified throttling setup:
- Simulated throttling remains the default setting. This matches the setup of PageSpeed Insights and the Lighthouse CLI default, maintaining cross-tool consistency.
- If you click the
View Original Tracebutton, the trace values will not match up with Lighthouse's metric results, as the original trace is prior to the simulation.
- If you click the
- DevTools throttling is available within the Lighthouse panel settings (⚙): select DevTools throttling from the throttling method dropdown.
- In this mode, the performance data seen after clicking the
View Tracebutton will match Lighthouses's numbers.
- In this mode, the performance data seen after clicking the
Of course, CLI users can still control the exact configuration of throttling.
This Performance Calendar article, Testing with Realistic Networking Conditions, has a good explanation of packet-level traffic shaping (which applies across TCP/UDP/ICMP) and recommendations.
The @sitespeed.io/throttle npm package appears to be the most usable Mac/Linux commandline app for managing your network connection. Important to note: it changes your entire machine's network interface. Also, @sitespeed.io/throttle requires sudo (as all packet-level shapers do).
Windows? As of today, there is no single cross-platform tool for throttling. But there are two recommended Windows 7 network shaping utilities: WinShaper and Clumsy.
For Windows 10 NetLimiter (Paid option) and TMeter (Freeware Edition) are the most usable solutions.
# Install with npm
npm install @sitespeed.io/throttle -g
# Ensure you have Node.js installed and npm is in your $PATH (https://nodejs.org/en/download/)

# To use the recommended throttling values:
throttle --up 768 --down 1638 --rtt 150

# or even simpler (using a predefined profile)
throttle 3gfast

# To disable throttling
throttle --stop
For more information and a complete list of features visit the documentation on sitespeed.io website.
npm install @sitespeed.io/throttle -g

# Enable system traffic throttling
throttle 3gfast

# Run Lighthouse with its own network throttling disabled (while leaving CPU throttling)
lighthouse --throttling-method=devtools \
  --throttling.requestLatencyMs=0 \
  --throttling.downloadThroughputKbps=0 \
  --throttling.uploadThroughputKbps=0 \
  https://example.com

# Disable the traffic throttling once you see "Gathering trace"
throttle --stopLighthouse applies CPU throttling to emulate a mid-tier mobile device even when run on far more powerful desktop hardware.
Unlike network throttling where objective criteria like RTT and throughput allow targeting of a specific environment, CPU throttling is expressed relative to the performance of the host device. This poses challenges to variability in results across devices, so it's important to calibrate your device before attempting to compare different reports.
Lighthouse computes and saves a benchmarkIndex as a rough approximation of the host device's CPU performance with every report. You can find this value under the title "CPU/Memory Power" at the bottom of the Lighthouse report:

NOTE: In Lighthouse 6.3 BenchmarkIndex changed its definition to better align with changes in Chrome 86. Benchmark index values prior to 6.3 and Chrome 86 may differ.
Below is a table of various device classes and their approximate ranges of benchmarkIndex as of Chrome m86 along with a few other benchmarks. The amount of variation in each class is quite high. Even the same device can be purchased with multiple different processors and memory options.
| - | High-End Desktop | Low-End Desktop | High-End Mobile | Mid-Tier Mobile | Low-End Mobile |
|---|---|---|---|---|---|
| Example Device | 16" Macbook Pro | Intel NUC i3 | Samsung S10 | Moto G4 | Samsung Galaxy J2 |
| Lighthouse BenchmarkIndex | 1500-2000 | 1000-1500 | 800-1200 | 125-800 | <125 |
| Octane 2.0 | 30000-45000 | 20000-35000 | 15000-25000 | 2000-20000 | <2000 |
| Speedometer 2.0 | 90-200 | 50-90 | 20-50 | 10-20 | <10 |
| JavaScript Execution of a News Site | 2-4s | 4-8s | 4-8s | 8-20s | 20-40s |
By default, Lighthouse uses a constant 4x CPU multiplier which moves a typical run in the high-end desktop bracket somewhere into the mid-tier mobile bracket.
You may choose to calibrate if your benchmarkIndex is in a different range than the above table would expect. Additionally, when Lighthouse is run from the CLI with default settings on an underpowered device, a warning will be added to the report suggesting you calibrate the slowdown:

The --throttling.cpuSlowdownMultiplier CLI flag allows you to configure the throttling level applied. On a weaker machine, you can lower it from the default of 4x to something more appropriate.
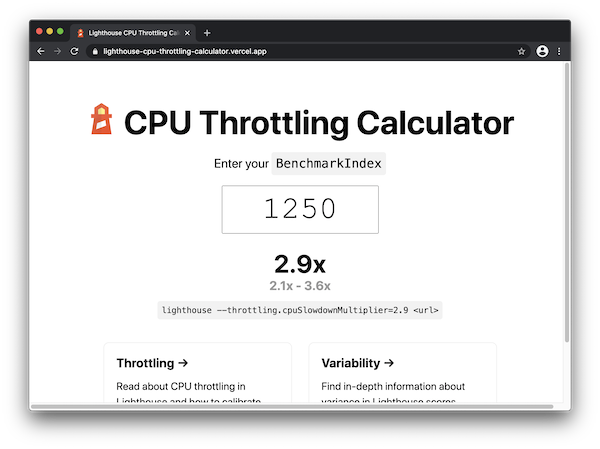
The Lighthouse CPU slowdown calculator webapp will compute what multiplier to use from the CPU/Memory Power value from the bottom of the report.
Alternatively, consider the below table of the various cpuSlowdownMultipliers you might want to use to target different devices along with the possible range:
| - | High-End Desktop | Low-End Desktop | High-End Mobile | Mid-Tier Mobile | Low-End Mobile |
|---|---|---|---|---|---|
| High-End Desktop | 1x | 2x (1-4) | 2x (1-4) | 4x (2-10) | 10x (5-20) |
| Low-End Desktop | - | 1x | 1x | 2x (1-5) | 5x (3-10) |
| High-End Mobile | - | - | 1x | 2x (1-5) | 5x (3-10) |
| Mid-Tier Mobile | - | - | - | 1x | 2x (1-5) |
| Low-End Mobile | - | - | - | - | 1x |
If your device's BenchmarkIndex falls on the higher end of its bracket, use a higher multiplier from the range in the table. If your device's BenchmarkIndex falls on the lower end of its bracket, use a lower multiplier from the range in the table. If it's somewhere in the middle, use the suggested multiplier.
# Run Lighthouse with a custom CPU slowdown multiplier
lighthouse --throttling.cpuSlowdownMultiplier=6 https://example.comWithin web performance testing, there are two typical styles of CPU throttling:
- Simulated throttling, which Lighthouse uses by default, uses a simulation of a page load, based on the data observed in the initial unthrottled load. This approach makes it very fast. However, due to the imperfect nature of predicting alternate execution paths, there is inherent inaccuracy that is summarized in this doc: Lighthouse Metric Variability and Accuracy. The TLDR: while it's fairly accurate for most circumstances, it suffers from edge cases and a deep investigation to performance should use DevTools CPU throttling tools.
- DevTools throttling , also called
devtoolsthrottling in Lighthouse configuration. This method actually interrupts execution of CPU work at periodic intervals to emulate a slower processor. It is fairly accurate and much easier than obtaining target hardware. The same underlying principle can be used by linux cgroups to throttle any process, not just the browser. Other tools like WebPageTest use CPU throttling offered by DevTools.