We're building a dashboard of key metrics for the USA because: If you can't measure it, you can't manage it. When complete, you'll be able to see how well the country is doing along a number of metrics at a glance. We strive to paint an objective, centralized picture of what's currently going on, with very timely updates. We hope that by making this information easily visible and available that we can come to a collective understanding about whether the country is thriving or not.
Sound good? Get involved Check out information about Data for Democracy and email Jonathon Morgan for an invitation.
Maintainers:
- @devinaconley
- @sraithel
Background
Contributing
Metrics
Architecture
The problem that this solves Often we only pay attention to data when someone decides to perform an analysis and share it with us. If we automate key analyses and pay attention on a regular basis, we'll all be more familiar with the health of the country and know what to prioritize. We'll also be able to hold politicians accountable for their actions if we see that metrics change abruptly.
Doesn't the government already do this? Yes, the government collects original data and produces regular reports. We want to centralize this information and make it easier to digest for citizens. For instance, crime data is available from each city, but only the FBI periodically merges it all and produces a yearly report. We can do better than this in 2017.
We have several streams of work going on right now, each attached to a milestone or issue:
- Bring an easy metric end-to-end: Build out the entire pipeline for scraping, analyzing and publishing data. This should be a valuable proof of concept, and momentum builder to iterate from.
- Improve documentation: Want to remove blockers, facilitate contribution, and keep people moving.
- Exploratory data analysis: After data is collected, it needs to be validated and modeled before we will visualize it. Reach out on the slack channel for access to the Mode Analytics workspace.
- Deciding what to capture for other metrics: We need to decide what else would be good to capture. Deciding on good metrics is our most important challenge.
- Designing the user interface: Ultimately people will consume the dashboard through web and mobile interfaces, as well as through sharing graphics we produce. We need help designing all of these surfaces.
- Merging crime data: While this is a crucial piece of the crime effort, it has proven to be quite a blocker. This is being temporarily being pushed to the backlog until we have more momentum
- Scraping crime data: We have quite a few cities covered, but we'd like to cover the top.
Once we have collected more data, there will be substantive data engineering tasks to automate all of this.
A metric is a measurement that is made on a regular basis so that we compare it over time. We want to measure key indicators that span a number of aspects of the USA:
- crime and violence
- housing/rent prices
- environment and climate change
- jobs/employment
- poverty/welfare/homelessness
- civil rights
- public health/healthcare
- education
- investment in basic science and art
This list is not meant to be exhaustive! Any high-quality metric can be added to the dashboard. Help us find some!
Good metrics have the following characteristics:
- Sensitivity: It moves regularly when things change, but does not move too randomly.
- Timeliness: The measurement does not lag reality too much. Finding out that something is going wrong a month after it happens is not very useful.
- Construct validity: It measures something important that we care about. It is defined well enough that we can compare over time.
- Historically available: Not a deal-break, but being able to measure at least a year of history is helpful.
We are striving to produce metrics that are updated at least once a week, and ideally every day. To do that we are going to engage in original data collection and also advanced statistical modeling and nowcasting.
Below is the high level plan for the project architecture:
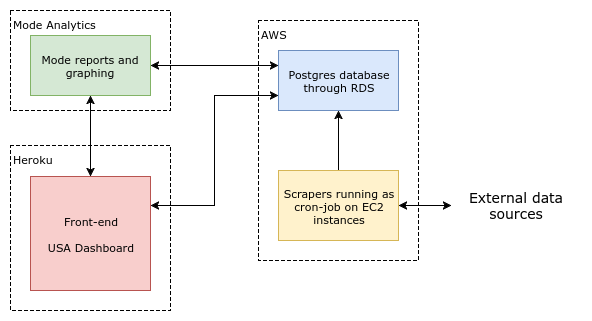
Feel free to propose any changes, especially if it is a piece you are working on.