Skip to content
New issue

Have a question about this project? Sign up for a free GitHub account to open an issue and contact its maintainers and the community.

By clicking “Sign up for GitHub”, you agree to our terms of service and privacy statement. We’ll occasionally send you account related emails.

Already on GitHub? Sign in to your account

Make a metric.table! #44

Closed
void-elf opened this issue Jun 23, 2017 · 16 comments
Closed

Make a metric.table! #44

void-elf opened this issue Jun 23, 2017 · 16 comments
Assignees

Comments

@void-elf
Copy link
Contributor

... in bottom right corner, includes a "edit on github" button.

As a last resort, use: from IPython.display import html.

@pde
Copy link
Member

pde commented Jun 23, 2017

Let's use this branch for this.

@pde
Copy link
Member

pde commented Jun 23, 2017

In it, the Metric class is in taxonomy.py, so you should be able to more sensibly add methods to it there.

@void-elf
Copy link
Contributor Author

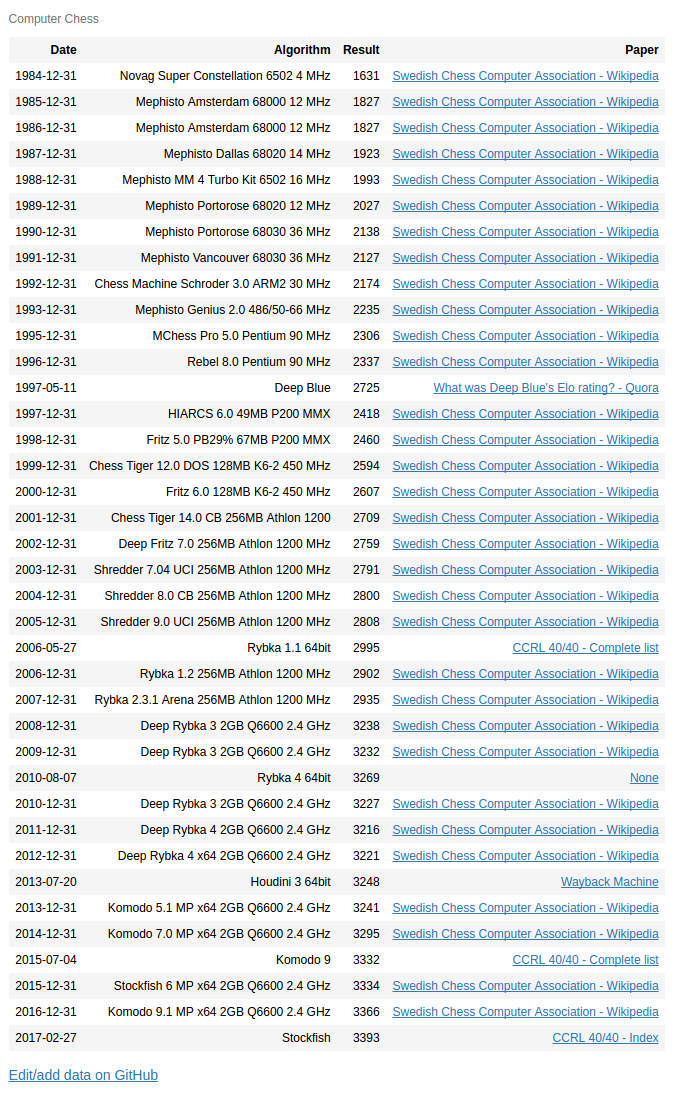
What was the scope of this issue again? Was it just displaying a nice table based on the measurements for that specific metric (and if so, why isn't this part of #46)?

And what were we going to do with the "edit on github" button? I vaguely remember something about letting users modify the data via CSVs.

Also, how does this table look:

selection_028

@pde
Copy link
Member

pde commented Jun 29, 2017

  1. It wasn't part of An alternative browser/visualization based on D3 #46 because it predates An alternative browser/visualization based on D3 #46. I'm still resisting using JSON+JavaScript for all of our data display, but I can maybe be talked into it.
  2. The table is the nice way we show all the results now that the raw data is being moved into separate python files, which can be edited in a nice way with links like this
  3. Your table above looks like a good start! Will make a slightly more polished example here in a sec

@pde
Copy link
Member

pde commented Jun 29, 2017

Here's what I imagine this looking like:

Date Algorithm Result Paper
2015-06-10 Attentive Reader 63.0 Teaching Machines to Read and Comprehend
2015-06-10 Impatient Reader 63.8 Teaching Machines to Read and Comprehend
2015-06-10 AIA 63.8 Iterative Alternating Neural Attention for Machine Reading
... ... ... ...

edit this data on Github

@pde
Copy link
Member

pde commented Jun 29, 2017

(except the "edit this data on github" link would be smaller and right-aligned?

I'm wondering whether to

  1. use the Papername as a hyperlink, as shown above; or
  2. have a separate paper name and URL; or
  3. Papername as hyperlink plus the explicit arXiv paper ID, where applicable, since those are sometimes useful

@void-elf
Copy link
Contributor Author

I will stick to #1 (papername as hyperlink). I don't think adding the arxiv ID (pictured below) is all that helpful or nice to look at:

Date Algorithm Result Paper
2015-06-10 Attentive Reader 63.0 Teaching Machines to Read and Comprehend (arxiv ID: 1506.03340)
2015-06-10 Impatient Reader 63.8 Teaching Machines to Read and Comprehend (arxiv ID: 1506.03340)
zebra stripes are neat $1

@pde
Copy link
Member

pde commented Jun 29, 2017

In some cases we'll want to add ± on the result (if min_val / max_val are not the same as the result) . Not sure how best to represent date ranges, either writing out the full range or just adding a *

@pde
Copy link
Member

pde commented Jun 29, 2017

There are probably more columns we'll want to add either now or in the future. For instance links to source code (which currently are occasionally in the replicated field), or any notes that may be attached to the Measurement object.

@pde
Copy link
Member

pde commented Jun 29, 2017

But let's not worry about those immediately.

@void-elf
Copy link
Contributor Author

@pde So, I'm done making tables. For the "Edit me on GitHub" link, I've noticed that not all the data has been moved into the /data directory. Are you working on moving it, should I do it, or should I just skip anything that hasn't been moved for now?

@void-elf
Copy link
Contributor Author

I'm still resisting using JSON+JavaScript for all of our data display, but I can maybe be talked into it.

One advantage of using JSON or CSV files for storing data is that if people already have data lying around that they want to give us, it'll already be in a usable format. What we have now is very, very unusual by data analysis project standards and might scare people away (and requires them to know Python if they want to submit a PR, instead of a much more widespread data representation language).

@void-elf
Copy link
Contributor Author

void-elf commented Jun 30, 2017

Most recent commits on this: 136152f

Here's what the table looks like right now:
selection_029

Right-aligning the <p> element is mysteriously not working, but perhaps that's for the best, as the "Edit me" link won't accidentally visually blend into all the other links in the right column and more people are likely to see it.

edit: also right now the default "Edit me" link leads to the github page. I still need to edit the data_url field on all the metrics, but I need #44 (comment) answered.

@pde
Copy link
Member

pde commented Jun 30, 2017

Looks good in general! Obviously the computer chess/wikipedia case is a little weird but we can worry about that later...

@pde
Copy link
Member

pde commented Jun 30, 2017

Maybe the column title should be Paper / Source for now

@void-elf
Copy link
Contributor Author

void-elf commented Jul 3, 2017

I can't seem to get the table to render unless in each cell I explicitly include:

from IPython.display import HTML
HTML(metric_name.table())

I tried refactoring it into the table function with no luck. This seems less than ideal, as we'd have to include this in every cell we wanted tables to be displayed in. Can someone think of a more efficient way?

@pde pde mentioned this issue Jul 13, 2017
Sign up for free to join this conversation on GitHub. Already have an account? Sign in to comment
Labels
None yet
Projects
None yet
Development

No branches or pull requests

2 participants