Raicloud plot matlab #65
Comments
|
Matlab is no longer supported, if you can get it to work & update the tutorial we would be happy to add it! :) |
Sign up for free
to join this conversation on GitHub.
Already have an account?
Sign in to comment
Hello,
Thanks for this great resource. I am using the tutorial for Matlab which works fantastic, but I made these figures:
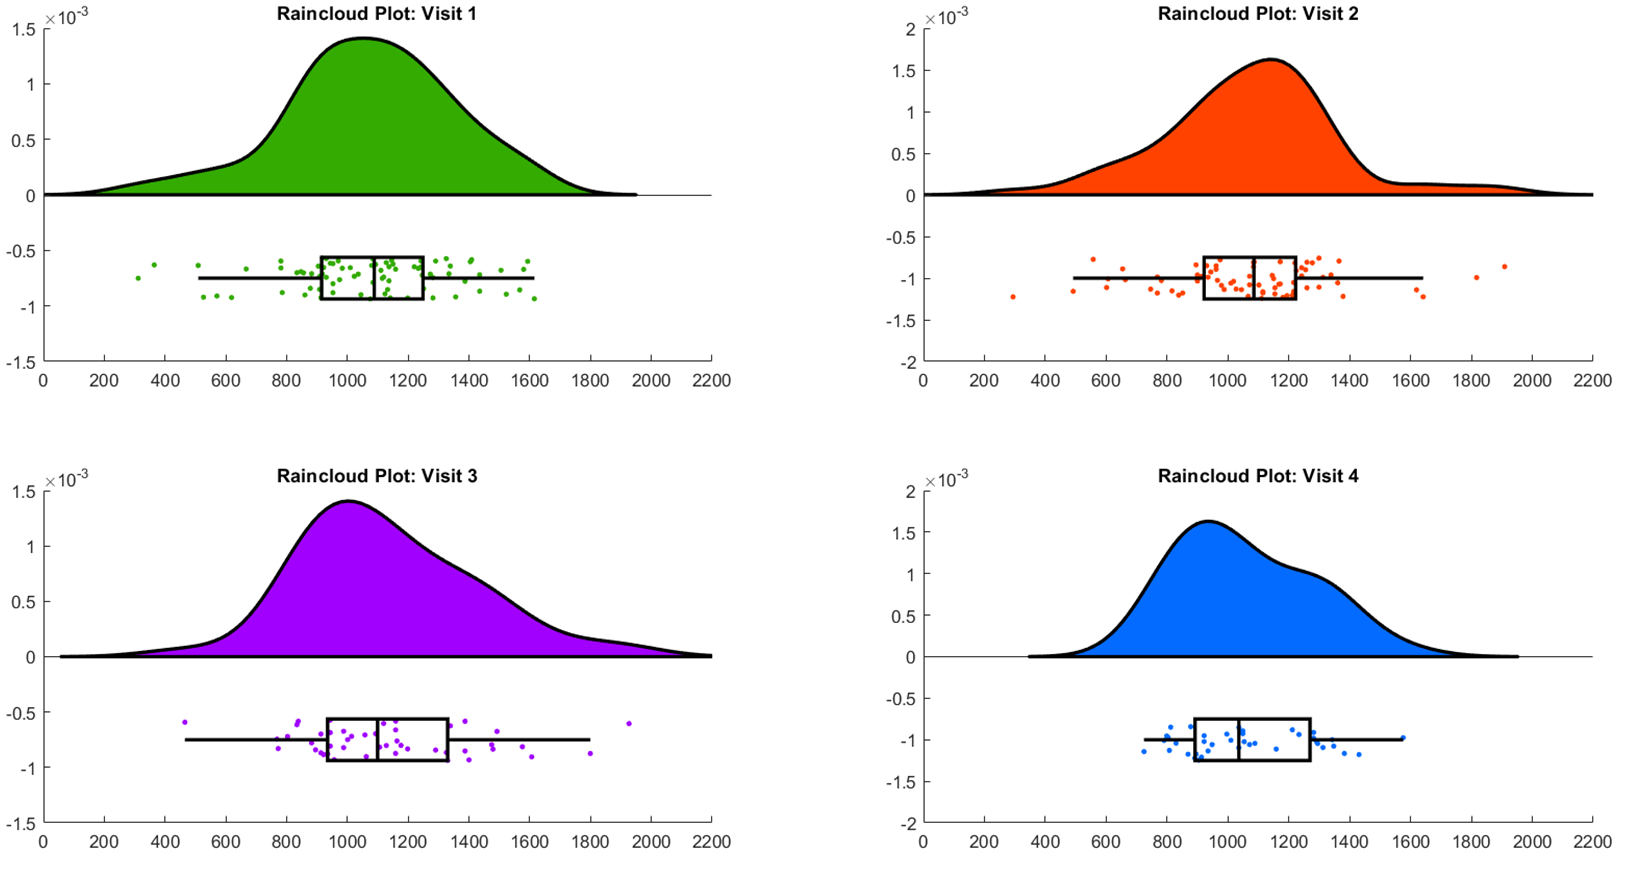
To make these, this is the part of the code I have used:
f3 = figure('Position', fig_position);
subplot(2, 2, 1)
h1 = raincloud_plot(d{1}, 'box_on', 1, 'color',[0.2 0.67 0], 'MarkerFaceColor', [0.2 0.67 0]);
title('Visit 1');
set(gca, 'XLim', [300 1400]);
box off
subplot(2, 2, 2)
h2 = raincloud_plot(d{2}, 'box_on', 1,'color',[1 0.26 0], 'MarkerFaceColor', [1 0.26 0]);
title('Visit 2');
set(gca, 'XLim', [300 1400]);
box off
subplot(2, 2, 3)
h3 = raincloud_plot(d{3}, 'box_on', 1,'color', [0.63 0 1], 'MarkerFaceColor', [0.63 0 1]);
title('Visit 3'); %
set(gca, 'XLim', [300 1400]);
box off
subplot(2, 2, 4)
h4 = raincloud_plot(d{4}, 'box_on', 1,'color', [0.01 0.42 1], 'MarkerFaceColor', [0.01 0.42 1]);
title('Visit 4');
set(gca, 'XLim',[300 1400]);
box off
However, I would want those individual plots to be within the same graph as the following:
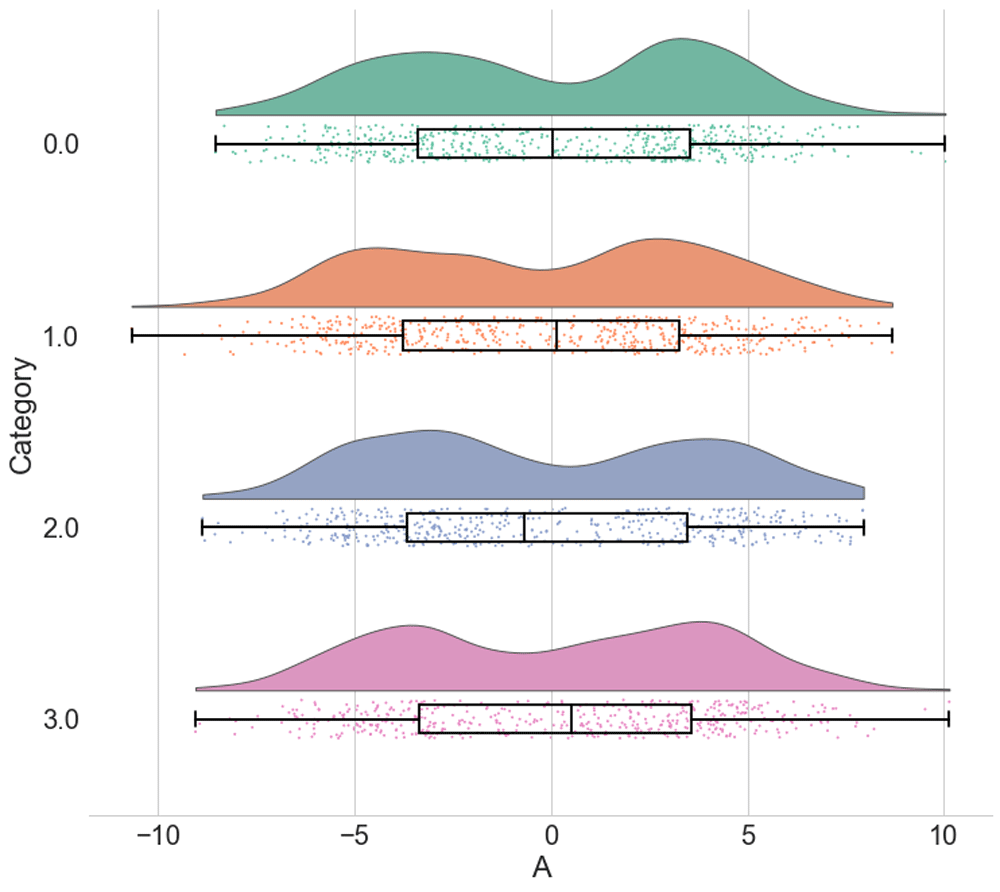
Am I missing the part of the code in the matlab tutorial script or has it not been provided just yet? In this case, would you have any suggestion for me to make the plots as the last image?
Thanks so much,
Eleonora
The text was updated successfully, but these errors were encountered: