logarithmic density estimate #31
Comments
|
Hi Kevin. Thanks for writing us! |
|
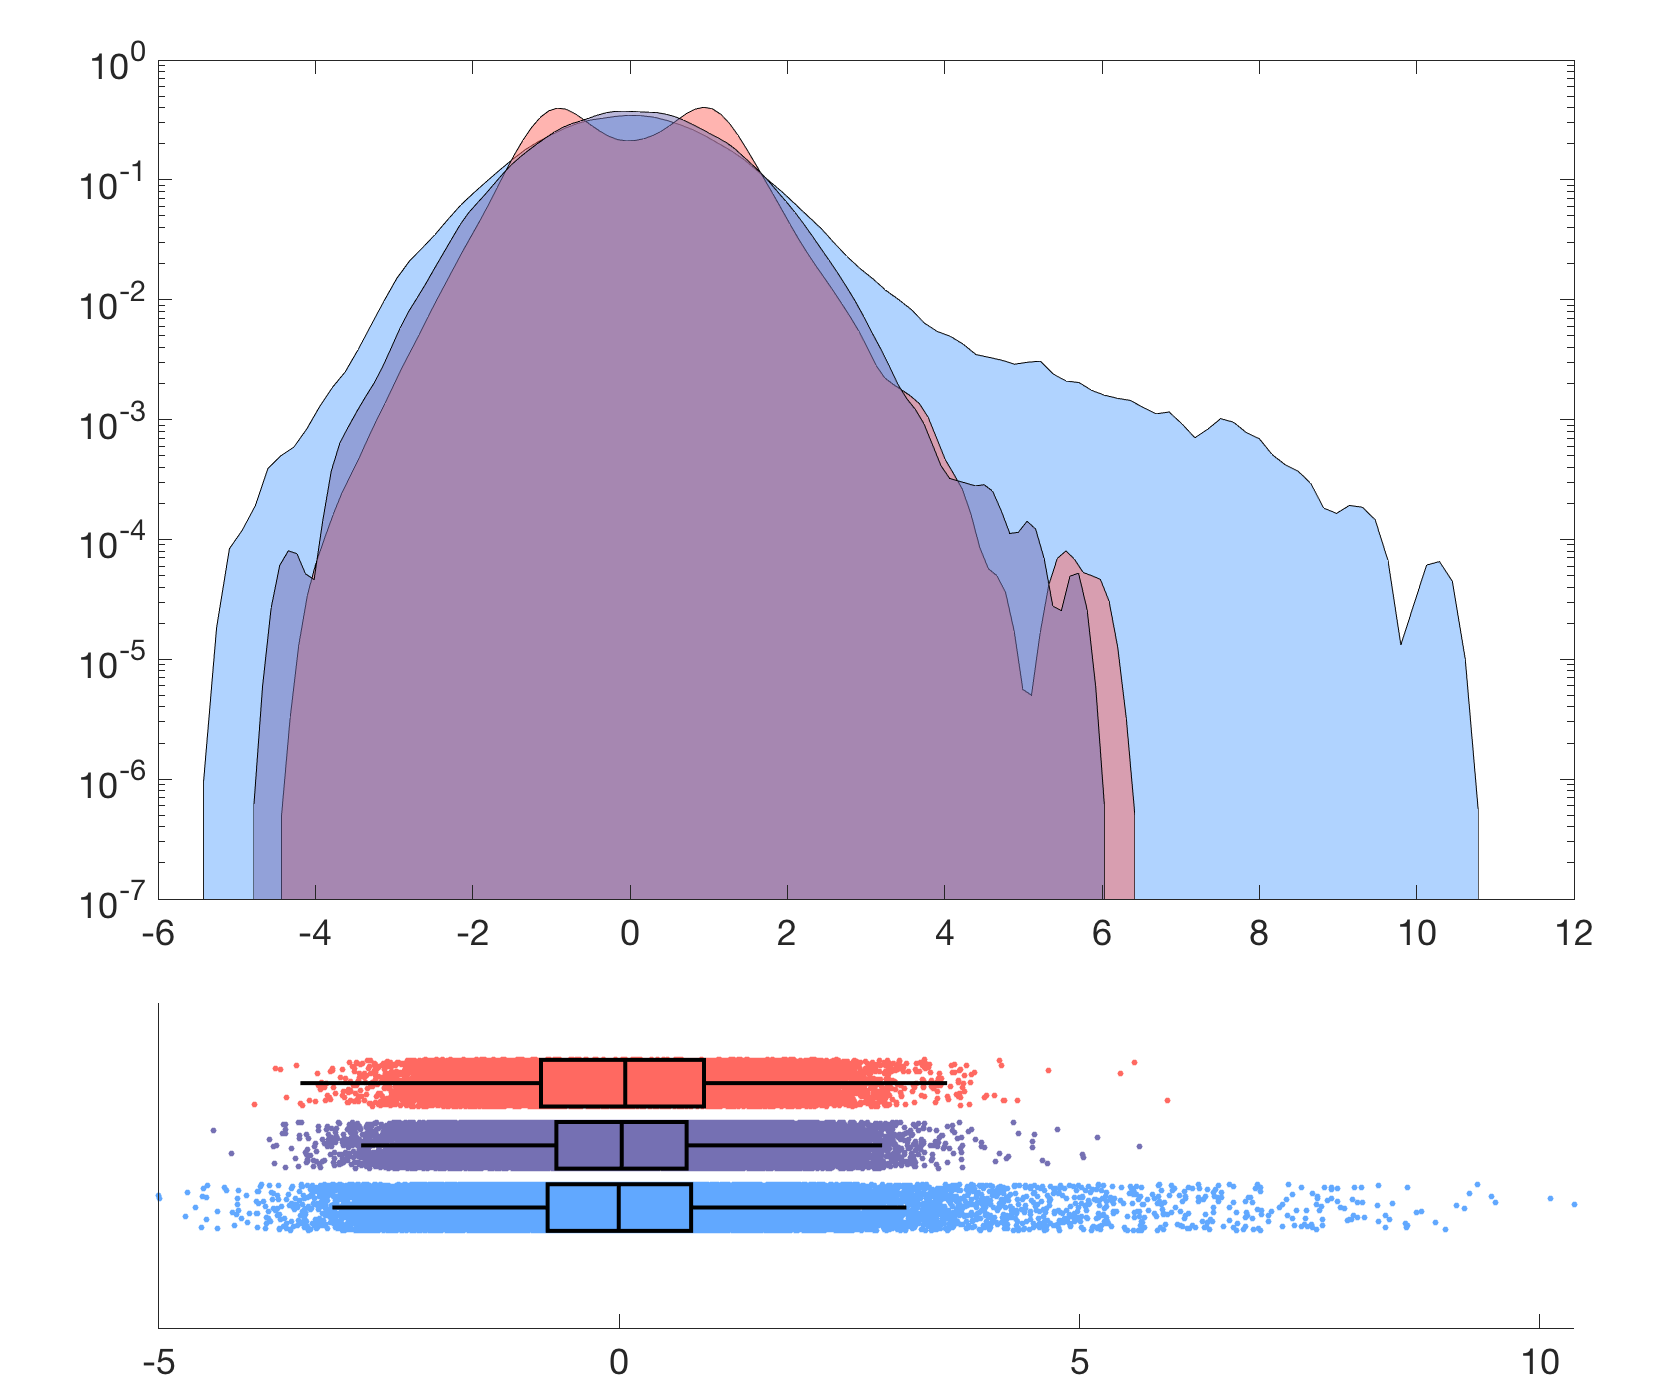
Hiya Davide, I'm using the Matlab implementation so I assume you mean changing the band_width of the KSD estimate? I tried changing this but the density plots seem to converge at the tails. The KSD estimate is not too bad but visually I think a logarithmic y-axis would useful to add to the standard raincloud plot - although it would be a log-rain-cloud plot. The distinction could be made clear if there was a y-axis displayed so one knows if we have a logarithmic or a standard rain-cloud plot, below is an example of a "log-rain-cloud" plot
|
|
I see your point, this is a choice one user could look for, as in the case of log-histograms. Can you show some code you used to make the logCloud? |
|
This does sound like something that could be an easy across-system add-on.
Once we see the python implementation we can discuss adding more generally.
On Mon, 3 Jun 2019 at 14.23, davide poggiali ***@***.***> wrote:
I see your point, this is a choice one user could look for, as in the case
of log-histograms. Can you show some code you used to make the logCloud?
—
You are receiving this because you are subscribed to this thread.
Reply to this email directly, view it on GitHub
<#31?email_source=notifications&email_token=AKDTU5BOEMHESVQ72TGRQYLPYUEMTA5CNFSM4HRROCZ2YY3PNVWWK3TUL52HS4DFVREXG43VMVBW63LNMVXHJKTDN5WW2ZLOORPWSZGODWZHIDY#issuecomment-498234383>,
or mute the thread
<https://github.com/notifications/unsubscribe-auth/AKDTU5DVNQN4TFJWG4E3WSTPYUEMTANCNFSM4HRROCZQ>
.
--
Dr. Micah Allen
Associate Professor @ AIAS <http://aias.au.dk/> &
Senior Research Fellow @ Cambridge Psychiatry
<http://www.psychiatry.cam.ac.uk/>
micahallen.org
+44 07473513511
|
|
Sorry for the delay, was writing this just before a conference! Here is a section of code I hacked together rather quickly to do this: This is clunky 🙈 and fit for my purpose in Matlab. It is tricky to get the logarithmic axes working so the box plot with the rain drops need to be made in a different axis to the cloud. In action its in a latest ms I've submitted : https://www.biorxiv.org/content/10.1101/662726v1 figure 12 |
Hi all,
First off, love the repo!
Secondly, I was wondering what types of features can help with visualising the tails of distributions? I currently have three datasets with different tails, the "drops" do a nice job of visualising the tails, but I feel like the default density estimate is lacking in that regard - I would typically analyse the density estimate with a logarithmic scaling (see second plot)
Are there features in the pipeline to deal with this (now or in the future)? It makes the raincloud plot a little different, but maybe this has been thought of already?
The text was updated successfully, but these errors were encountered: